Daniocell
lin9 (ionocytes / mucous-producing)
lin-9 DREAM MuvB core complex component
ZFIN
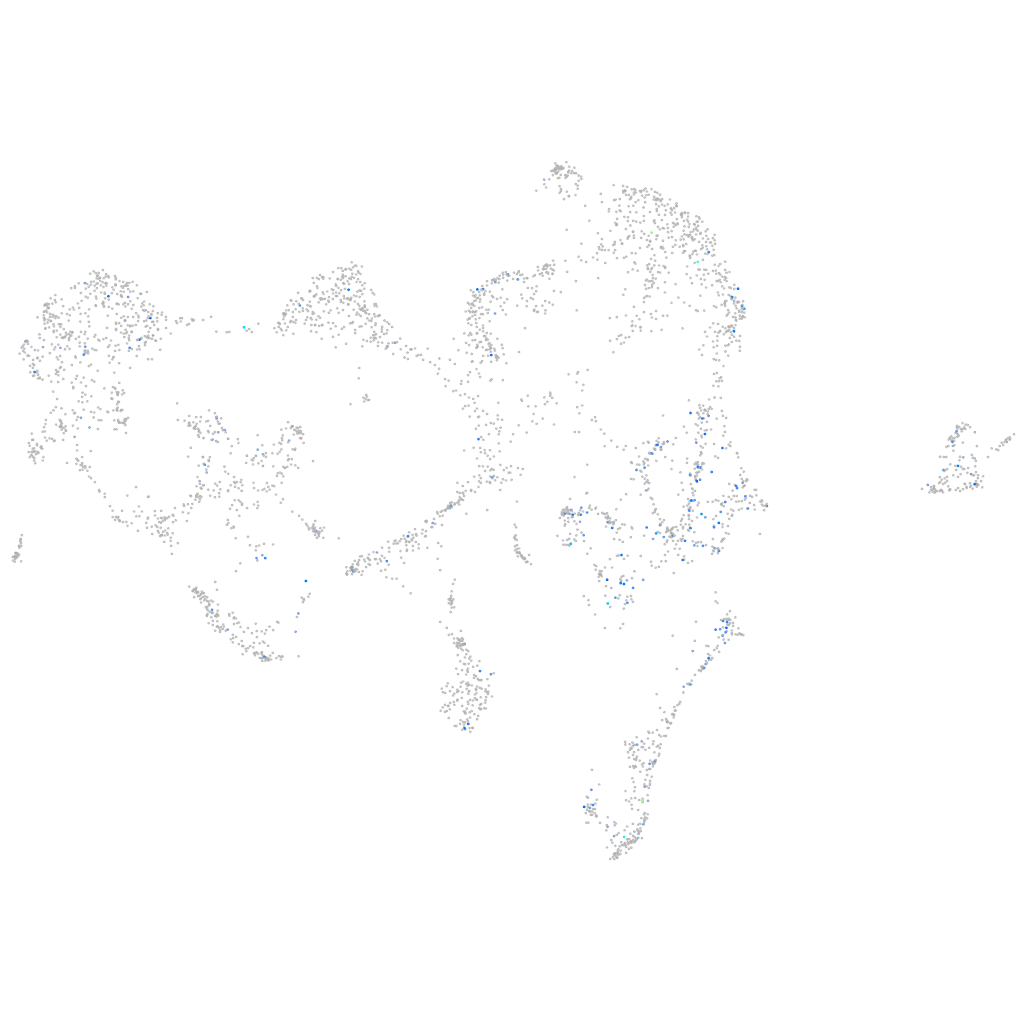
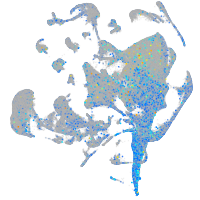
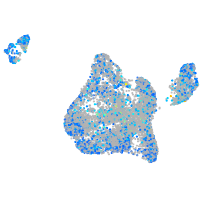
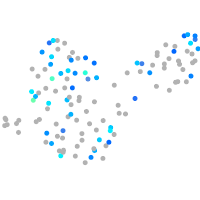
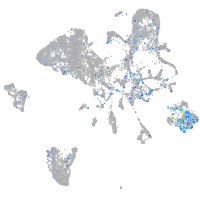
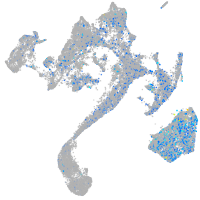
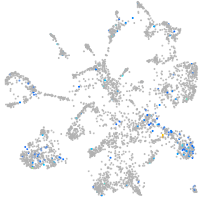
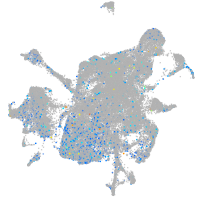
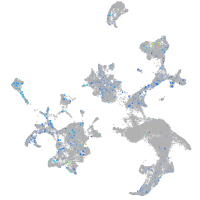
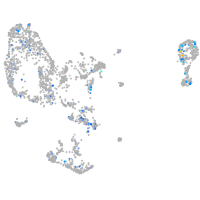
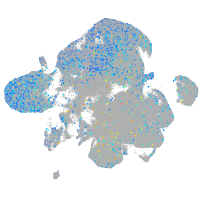
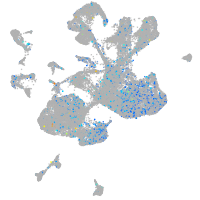
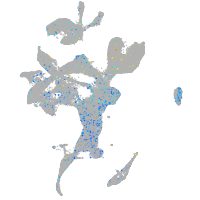
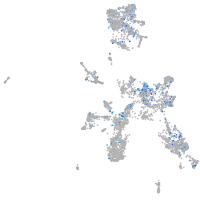
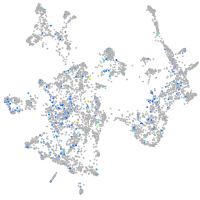
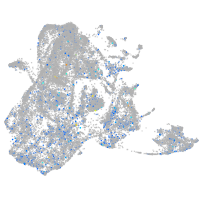
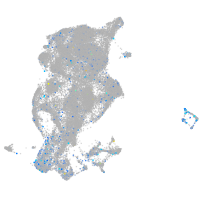
Gene expression UMAP
Display:
Expression
Stage
Other cell groups
all cells
blastomeres
PGCs
endoderm
axial mesoderm
muscle
mural cells /
non-skeletal muscle
mesenchyme
hematopoietic /
vasculature
pronephros
neural
spinal cord / glia
eye
taste / olfactory
otic / lateral line
epidermis
periderm
fin
ionocytes / mucous
pigment cells
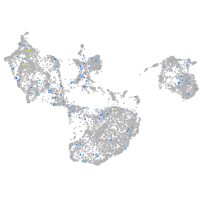
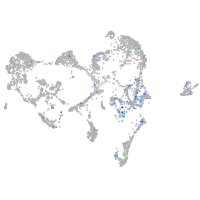
Expression by stage/cluster
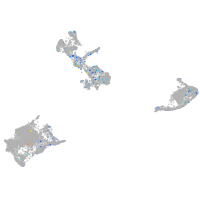
Correlated gene expression
Positive correlation
Negative correlation
Gene
r
Gene
r
si:dkey-78a14.4
0.216
ppl
-0.083
si:ch211-62a1.3
0.206
BX000438.2
-0.079
tmem125b
0.194
si:dkey-193p11.2
-0.078
si:ch211-247n2.1
0.193
wu:fb18f06
-0.072
LOC100147871
0.188
aldob
-0.071
zgc:113274
0.182
abcb5
-0.071
kcnh8
0.177
si:dkey-184p9.7
-0.069
slco1c1
0.162
mgst1.2
-0.069
ccdc175
0.156
zgc:110333
-0.068
LOC100536937
0.156
selenow1
-0.066
znf1166
0.156
zgc:193505
-0.066
CU550719.2
0.156
tdh
-0.066
si:dkey-222b8.4
0.154
cst14b.1
-0.063
si:ch211-10a23.2
0.150
ak1
-0.062
dnaaf3l
0.147
si:ch211-195b11.3
-0.062
stmn1a
0.146
rplp2
-0.060
si:ch211-69b22.5
0.143
icn2
-0.060
lrguk
0.143
agr1
-0.059
fhdc4
0.142
selenow2b
-0.058
hnrnpabb
0.142
tmem176l.4
-0.058
ssrp1a
0.141
krt17
-0.058
BX936308.2
0.141
cast
-0.056
tmem136b
0.140
si:dkey-248g15.3
-0.056
snrpd1
0.140
tcnbb
-0.055
hmga1a
0.139
gstp1
-0.055
grifin
0.139
apodb
-0.054
hmgb2b
0.139
ctss2.2
-0.054
spc25
0.139
soul2
-0.053
si:ch211-222l21.1
0.137
scel
-0.052
CU633857.1
0.137
XLOC-041945
-0.052
cdca5
0.136
sqstm1
-0.052
wdr27
0.136
si:dkey-221j11.3
-0.051
cfap100
0.136
DHDH
-0.051
ranbp1
0.135
zgc:153284
-0.051
cks1b
0.135
sft2d2a
-0.051