Daniocell
lhfpl5b (axial mesoderm)
LHFPL tetraspan subfamily member 5b
ZFIN
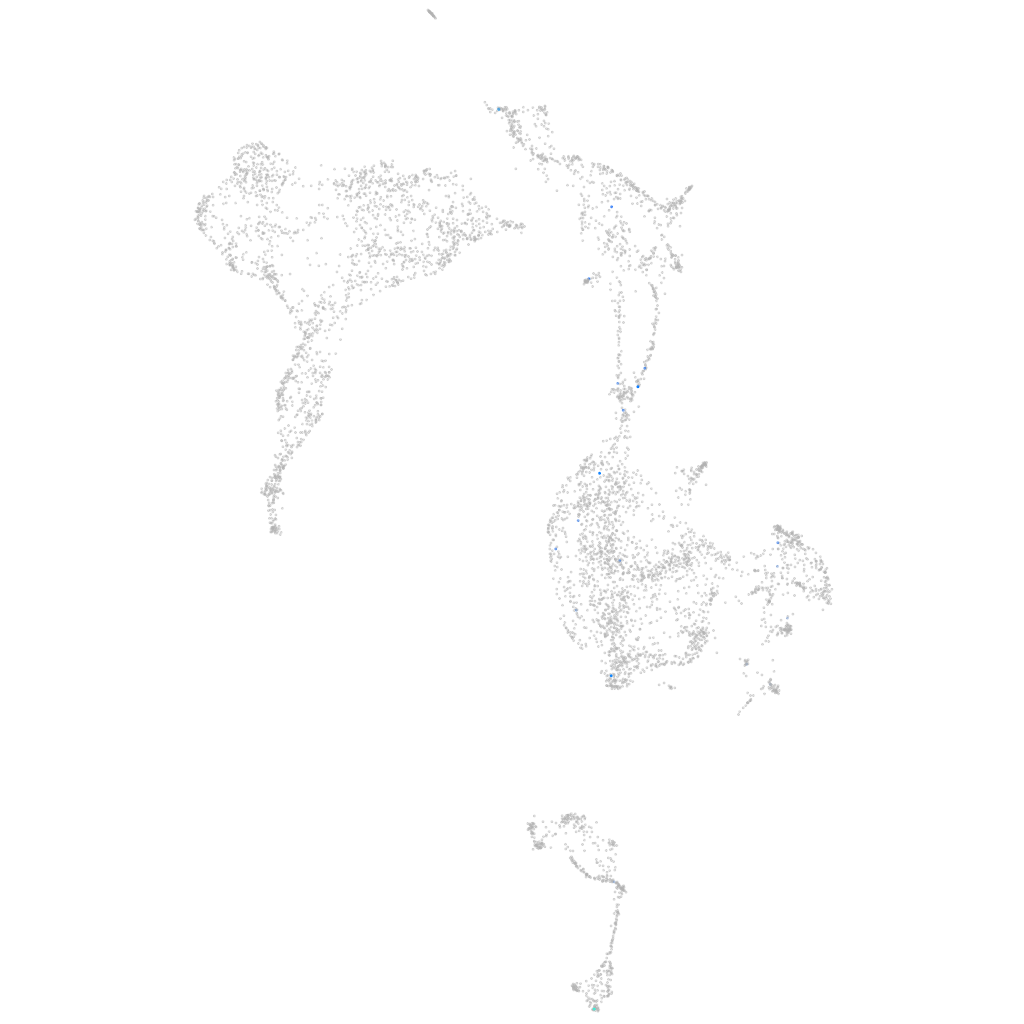
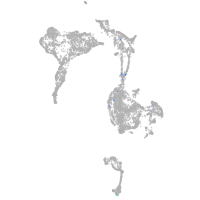
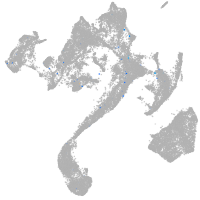
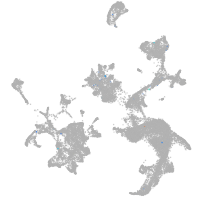
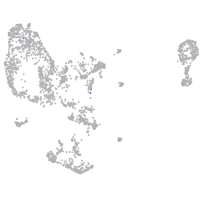
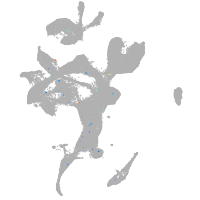
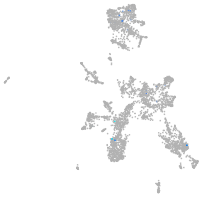
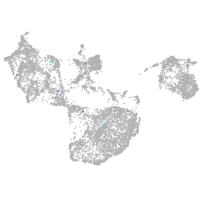
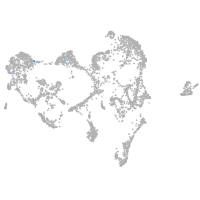
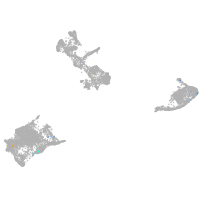
Gene expression UMAP
Display:
Expression
Stage
Other cell groups
all cells
blastomeres
PGCs
endoderm
axial mesoderm
muscle
mural cells /
non-skeletal muscle
mesenchyme
hematopoietic /
vasculature
pronephros
neural
spinal cord / glia
eye
taste / olfactory
otic / lateral line
epidermis
periderm
fin
ionocytes / mucous
pigment cells
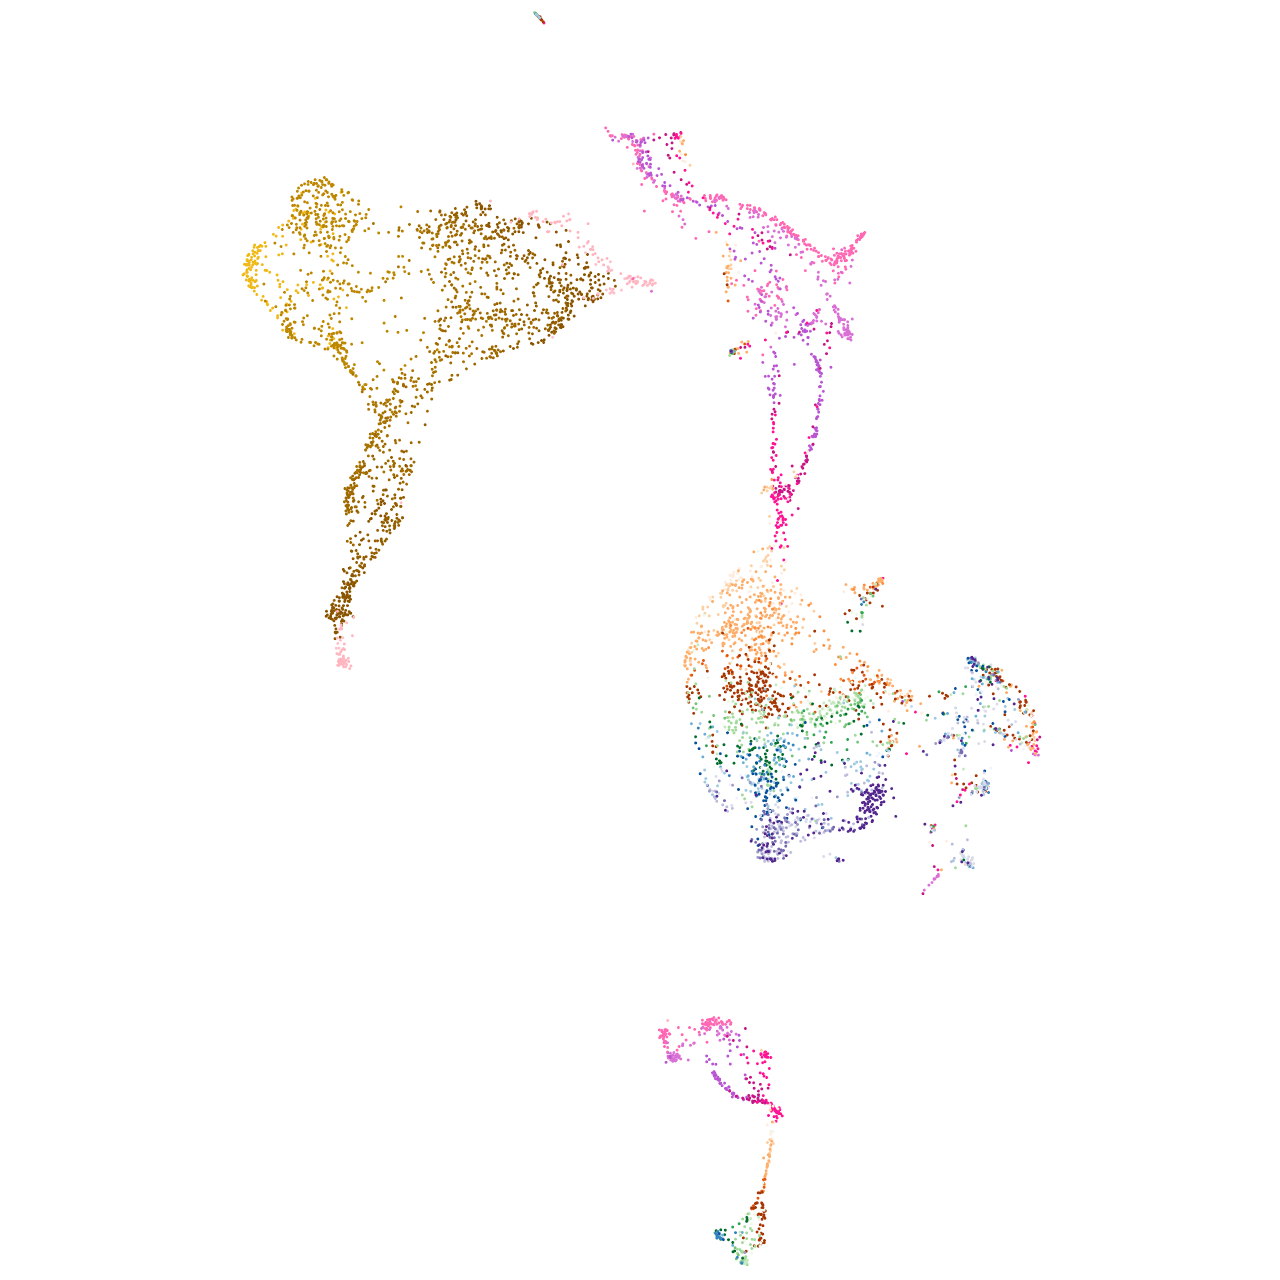
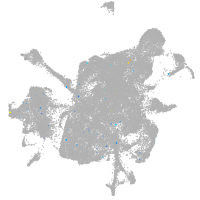
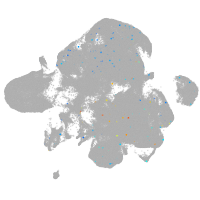
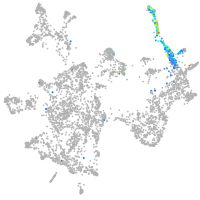
Expression by stage/cluster
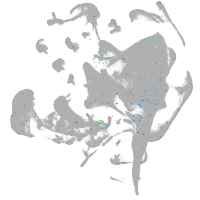
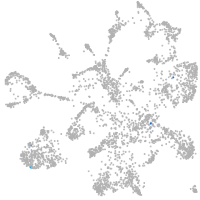
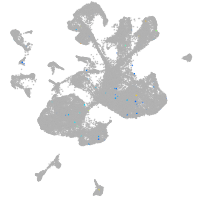
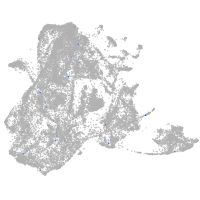
Correlated gene expression
Positive correlation
Negative correlation
Gene
r
Gene
r
LOC101882950
0.490
rps18
-0.052
CABZ01111555.1
0.473
ebna1bp2
-0.034
LOC100535033
0.471
phf5a
-0.034
TMEM114
0.435
smarca4a
-0.034
FP016234.1
0.424
nhp2
-0.034
cldn34a
0.415
stm
-0.033
BX572078.1
0.414
lyar
-0.033
b4galt5
0.405
pes
-0.033
XLOC-041002
0.383
gnl3
-0.033
CU019646.1
0.354
ddx18
-0.032
si:dkey-260c8.6
0.311
acin1b
-0.032
XLOC-015481
0.278
si:dkey-67c22.2
-0.032
mal2
0.268
rtf1
-0.032
hsd17b1
0.248
hnrnpa1b
-0.032
galn
0.242
eif2s1a
-0.032
upk1a
0.241
hspb1
-0.032
clec3bb
0.236
hnrnpa1a
-0.032
CU571324.1
0.232
snrnp70
-0.031
si:dkey-192l18.9
0.229
ube2na
-0.031
CU207354.2
0.228
sf3b2
-0.031
cyp2x10.2
0.226
brd3a
-0.031
LOC100330321
0.222
cirbpb
-0.031
LOC103910597
0.219
bms1
-0.030
si:dkey-23a13.8
0.217
hnrnpub
-0.030
PRRG3
0.215
si:ch211-152c2.3
-0.030
CU462915.1
0.212
snrpa1
-0.030
CR855865.1
0.208
khdrbs1b
-0.030
arhgef9b
0.207
max
-0.029
LOC110438040
0.204
seta
-0.029
zgc:165507
0.197
mphosph10
-0.029
usp43a
0.197
NC-002333.4
-0.029
znf1017
0.196
akap12b
-0.029
CABZ01084501.2
0.191
marcksb
-0.029
caps2
0.186
cirbpa
-0.029
zmp:0000000545
0.186
anp32e
-0.029