Daniocell
lgals3bpb (glial cells / spinal cord)
"lectin, galactoside-binding, soluble, 3 binding protein b"
ZFIN
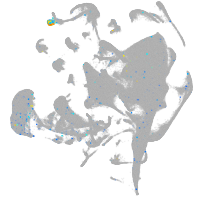
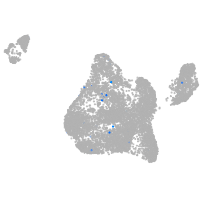
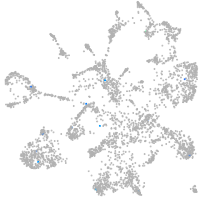
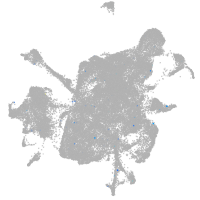
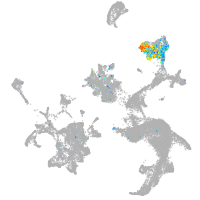
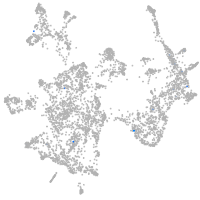
Gene expression UMAP
Display:
Expression
Stage
Other cell groups
all cells
blastomeres
PGCs
endoderm
axial mesoderm
muscle
mural cells /
non-skeletal muscle
mesenchyme
hematopoietic /
vasculature
pronephros
neural
spinal cord / glia
eye
taste / olfactory
otic / lateral line
epidermis
periderm
fin
ionocytes / mucous
pigment cells
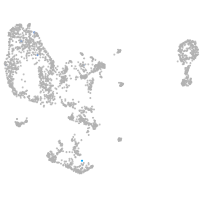
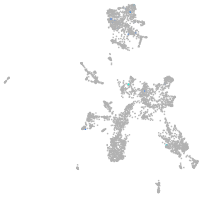
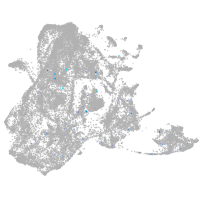
Expression by stage/cluster
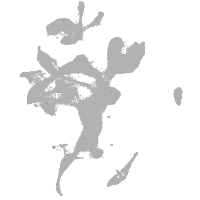
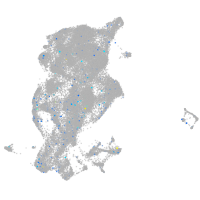
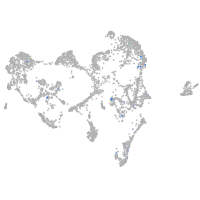
Correlated gene expression
Positive correlation
Negative correlation
Gene
r
Gene
r
hmha1b
0.189
zgc:114188
-0.021
XLOC-000666
0.156
rpl18
-0.020
zgc:113142
0.126
rpl30
-0.019
insl3
0.116
rpl27a
-0.018
CR361560.1
0.114
rps21
-0.017
b4galnt1a
0.102
rps11
-0.016
kcnt2
0.095
rpl13a
-0.016
CU929365.1
0.093
rps10
-0.015
ctsk
0.089
rpl13
-0.015
col8a1b
0.085
si:ch1073-429i10.3.1
-0.015
LOC101885980
0.085
si:ch211-194k22.8
-0.015
taar12e
0.077
tars
-0.015
XLOC-005294
0.075
h3f3c
-0.015
golph3l
0.075
tmco1
-0.015
LOC103908998
0.074
psmb2
-0.014
XLOC-014924
0.069
rpl9
-0.014
p2rx3a
0.066
hmgb1a
-0.014
eevs
0.066
ptp4a2a
-0.014
XLOC-021896
0.062
rpl17
-0.014
si:dkey-78k11.9
0.062
ewsr1a
-0.014
col4a3
0.061
mibp2
-0.014
avpr2aa
0.061
nova2
-0.014
CU984600.1
0.059
trappc3
-0.013
cp
0.058
rpl29
-0.013
BX649499.1
0.057
ube2e2
-0.013
LOC101884918
0.057
rps20
-0.013
CABZ01044765.1
0.056
copz1
-0.013
tdrd12
0.056
serf2
-0.013
XLOC-041558
0.054
faua
-0.013
gja3
0.054
pfn2l
-0.013
smarcd2
0.053
zgc:56525
-0.013
ptk2ba
0.052
hsp90b1
-0.013
si:ch211-231i17.4
0.051
arl6ip4
-0.012
si:ch211-202h22.9
0.049
rps4x
-0.012
plpp2b
0.049
psmd4a
-0.012