Daniocell
lamtor1 (mesenchyme)
"late endosomal/lysosomal adaptor, MAPK and MTOR activator 1"
ZFIN
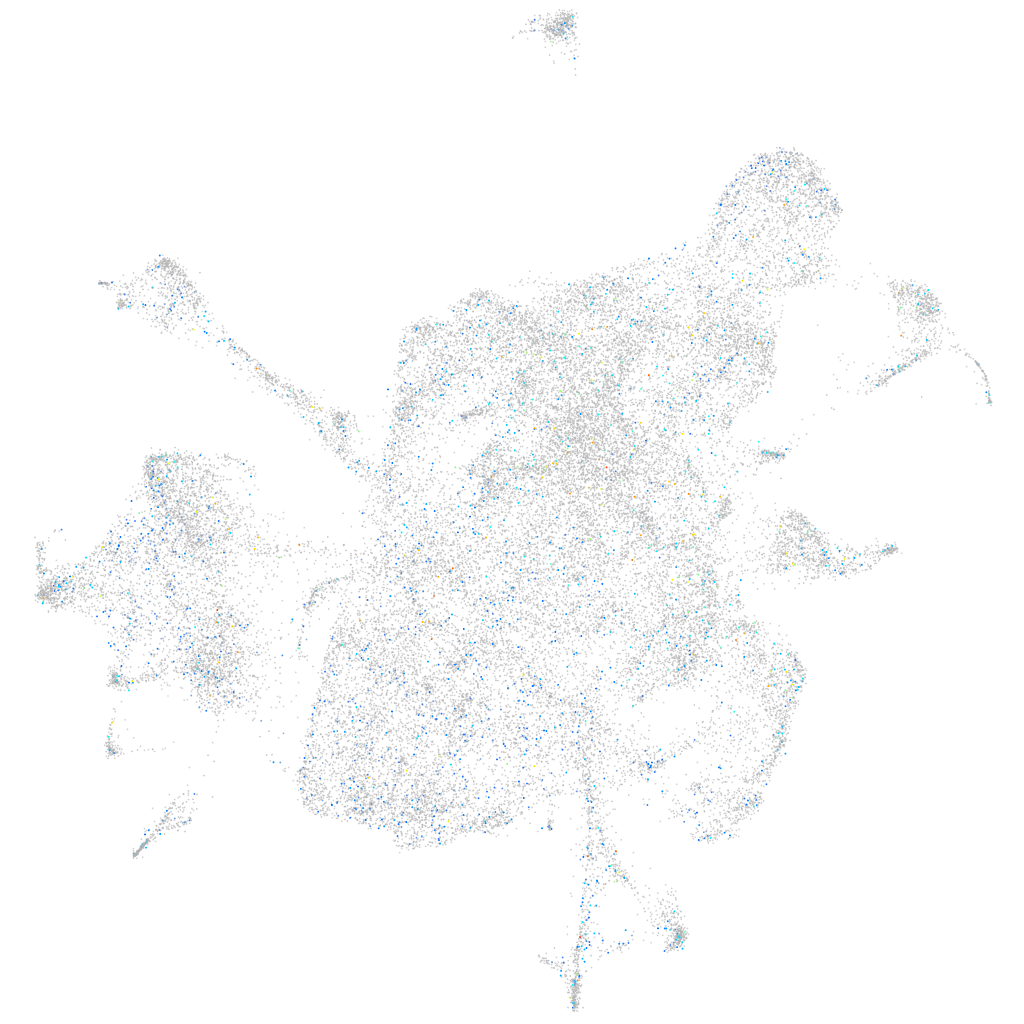
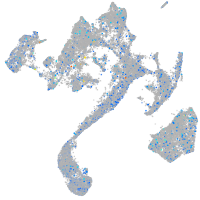
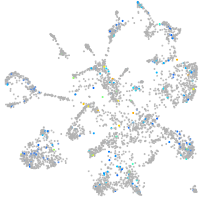
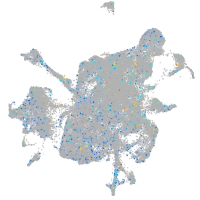
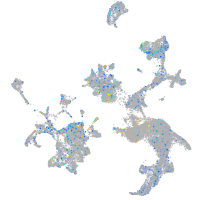
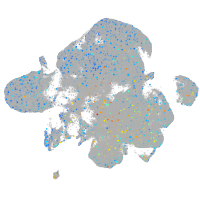
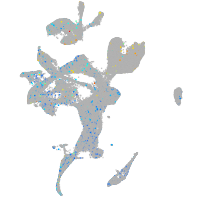
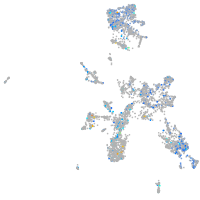
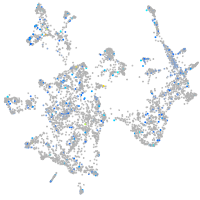
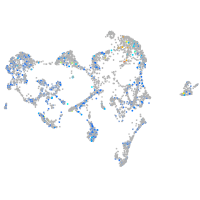
Gene expression UMAP
Display:
Expression
Stage
Other cell groups
all cells
blastomeres
PGCs
endoderm
axial mesoderm
muscle
mural cells /
non-skeletal muscle
mesenchyme
hematopoietic /
vasculature
pronephros
neural
spinal cord / glia
eye
taste / olfactory
otic / lateral line
epidermis
periderm
fin
ionocytes / mucous
pigment cells
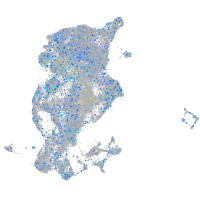
Expression by stage/cluster
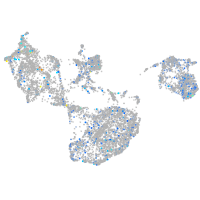
Correlated gene expression
Positive correlation
Negative correlation
Gene
r
Gene
r
chrnb3b
0.061
rplp1
-0.024
si:dkey-284p5.3
0.055
eef1a1l1
-0.021
si:dkey-33c12.12
0.048
rpl7
-0.020
si:ch1073-159d7.5.1
0.047
hbbe3
-0.020
rbm47
0.046
rplp0
-0.019
LOC108181419
0.046
rps19
-0.019
LOC110439344
0.044
si:dkey-151g10.6
-0.019
LOC566055
0.044
rps26l
-0.018
prok2
0.043
rpl28
-0.018
calhm3
0.043
rplp2l
-0.018
si:rp71-77l1.2
0.043
hsp90ab1
-0.018
FP102786.1
0.041
rps15a
-0.018
taar20f
0.041
rps20
-0.017
CR854927.3
0.040
rps23
-0.016
si:ch211-208g1.1
0.040
rpsa
-0.016
taar20d1
0.039
rpl10
-0.016
RF00566
0.039
rps25
-0.016
ccl19a.2
0.038
rpl36a
-0.016
flvcr2b
0.038
bccip
-0.015
v2ra17
0.038
rpl29
-0.015
cygb1
0.038
rpl18
-0.015
apof
0.038
rpl21
-0.015
caprin2
0.037
rps7
-0.015
igfbp2a
0.037
rpl13
-0.015
FP102171.1
0.037
rpl35a
-0.014
LOC101883054
0.036
rps2
-0.014
fabp11a
0.035
prim2
-0.014
dnai2b
0.035
rpl19
-0.014
vtg3
0.035
rps9
-0.014
slc38a3a
0.034
rpl24
-0.014
si:ch73-262h23.4
0.034
gadd45bb
-0.013
si:zfos-911d5.4
0.034
rps12
-0.013
BX072576.3
0.033
rps14
-0.013
atp1b4
0.033
rpl10a
-0.013
si:dkeyp-106c3.1
0.033
tyrp1b
-0.013