Daniocell
kif16ba (hematopoietic / vasculature)
kinesin family member 16Ba
ZFIN
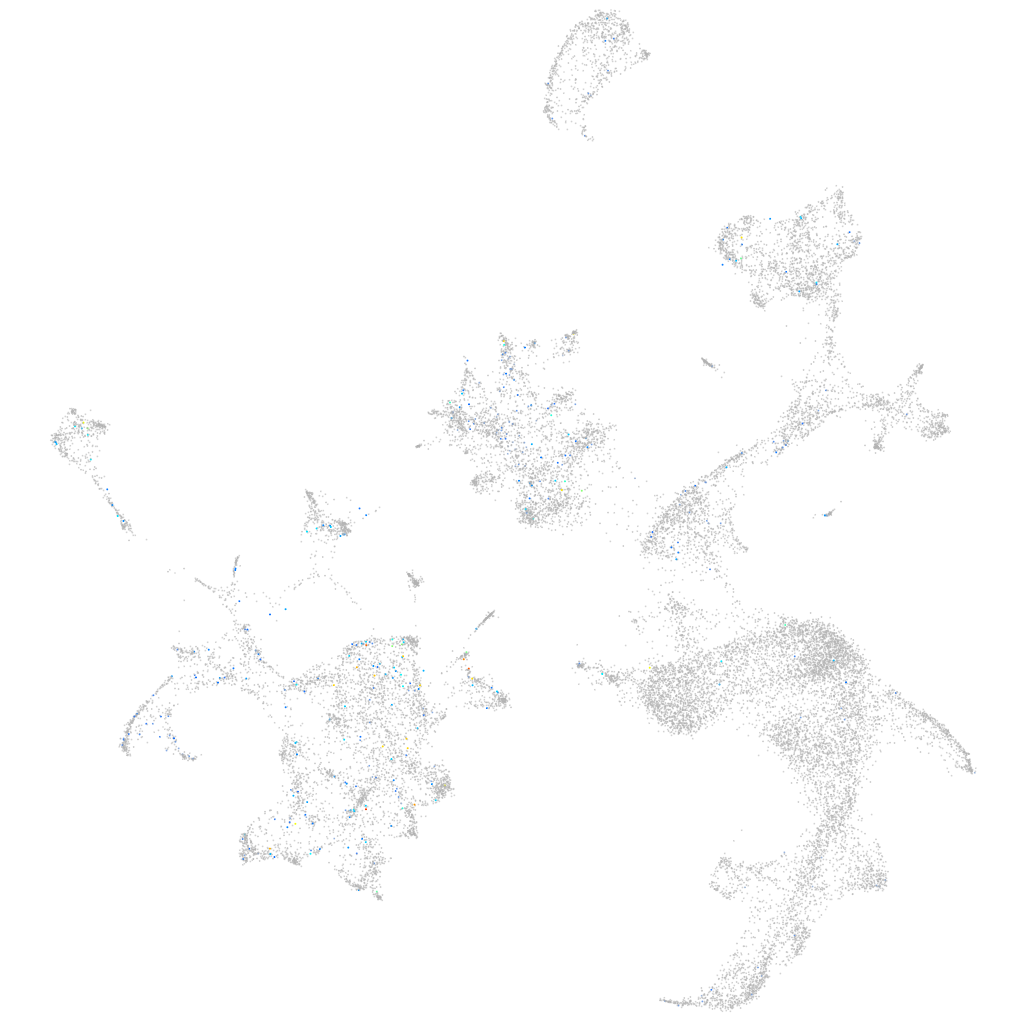
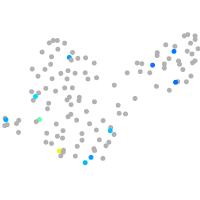
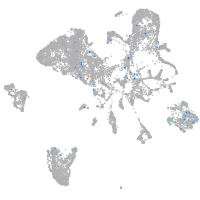
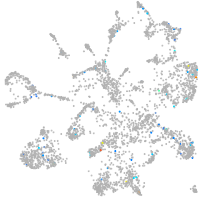
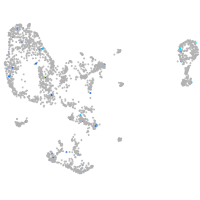
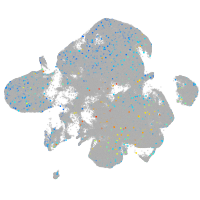
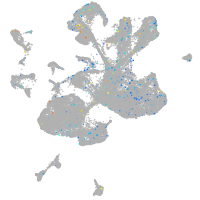
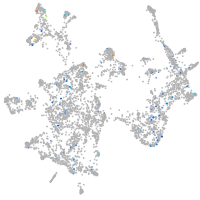
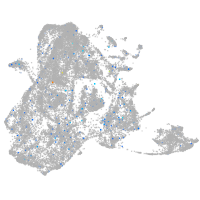
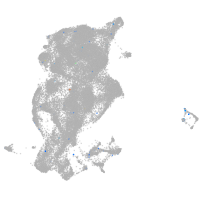
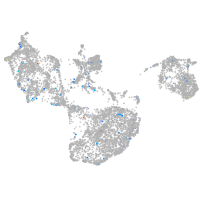
Gene expression UMAP
Display:
Expression
Stage
Other cell groups
all cells
blastomeres
PGCs
endoderm
axial mesoderm
muscle
mural cells /
non-skeletal muscle
mesenchyme
hematopoietic /
vasculature
pronephros
neural
spinal cord / glia
eye
taste / olfactory
otic / lateral line
epidermis
periderm
fin
ionocytes / mucous
pigment cells
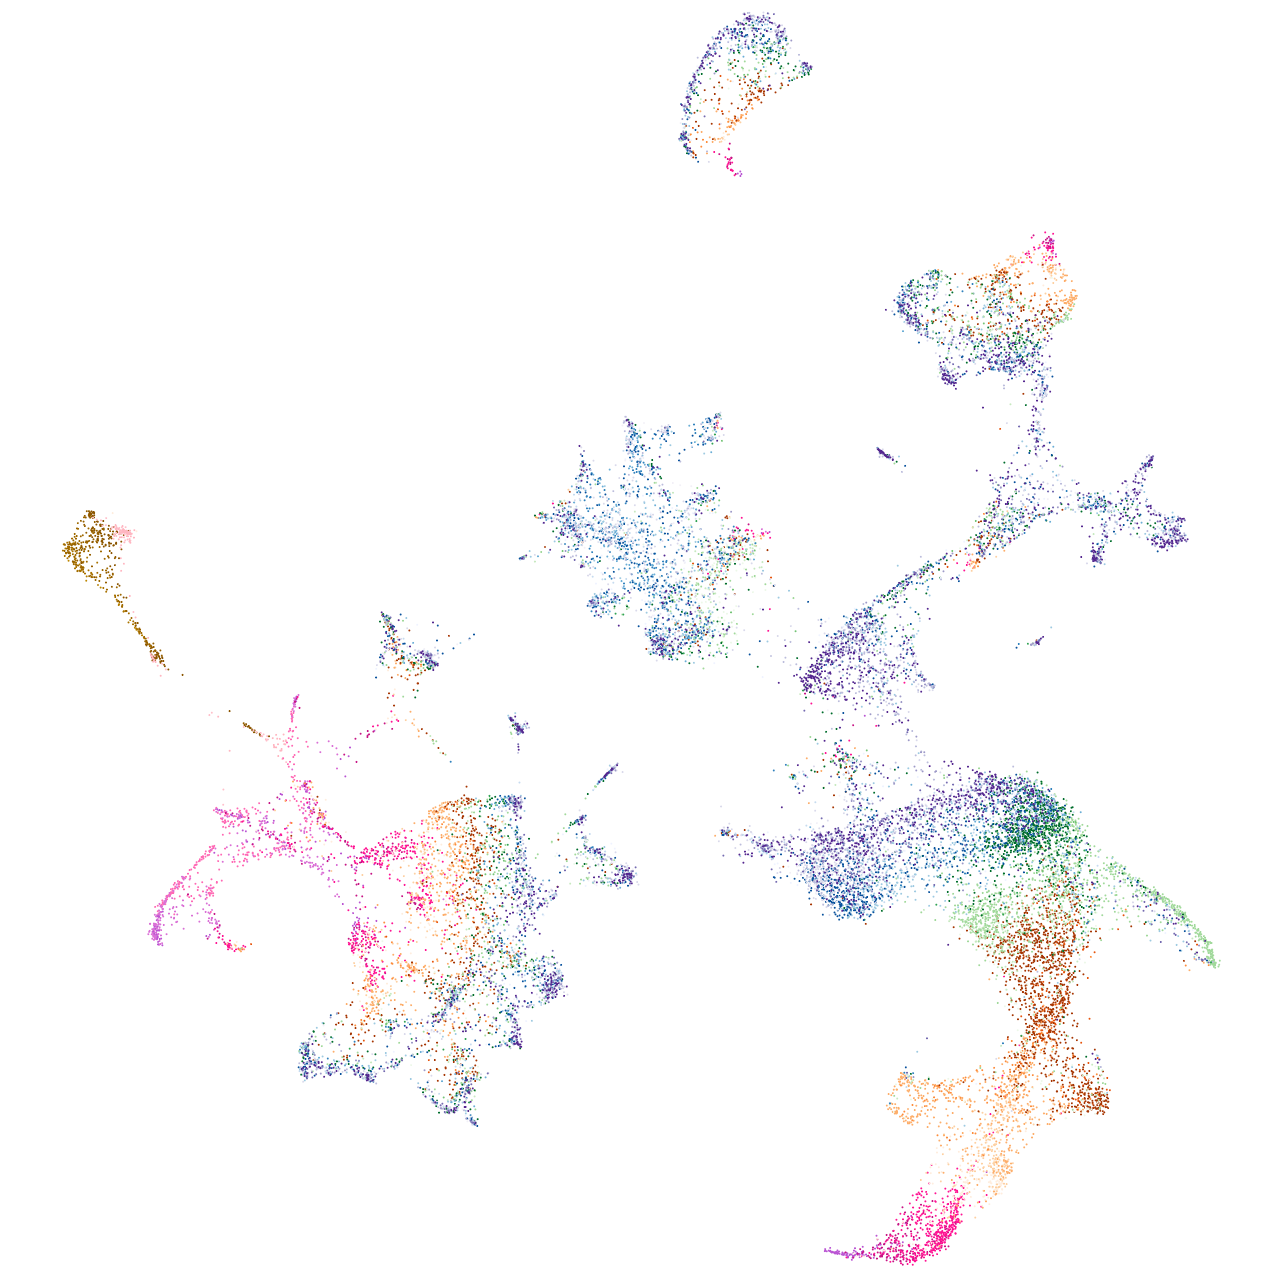
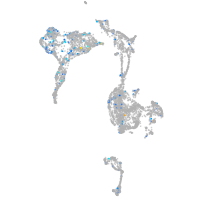
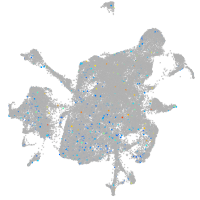
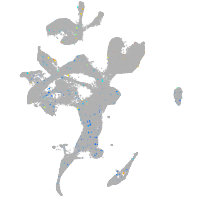
Expression by stage/cluster
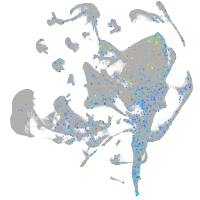
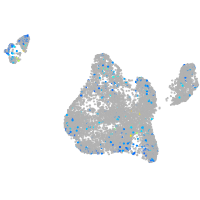
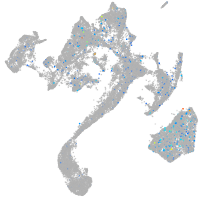
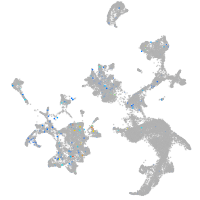
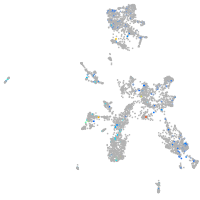
Correlated gene expression
Positive correlation
Negative correlation
Gene
r
Gene
r
BX571954.1
0.107
hbae3
-0.065
gal3st1b
0.102
cahz
-0.064
XLOC-015449
0.091
hbae1.3
-0.062
fstl1b
0.086
hbae1.1
-0.062
cd81a
0.084
hbbe2
-0.062
nos1apa
0.083
hemgn
-0.061
slc13a2
0.082
hbbe1.1
-0.061
LOC110438263
0.081
blvrb
-0.060
LOC110437966
0.080
prdx2
-0.060
LOC100535067
0.080
hbbe1.3
-0.060
LOC103910169
0.080
alas2
-0.057
LOC101885859
0.080
tspo
-0.056
fkbp1aa
0.079
nt5c2l1
-0.056
BX537120.3
0.078
fth1a
-0.056
si:ch211-157j23.3
0.078
creg1
-0.054
zgc:136767
0.078
slc4a1a
-0.053
si:dkey-205i10.2
0.078
hbbe1.2
-0.053
RF00093
0.078
zgc:163057
-0.050
LOC110439515
0.078
epb41b
-0.050
il26
0.077
si:ch211-250g4.3
-0.049
XLOC-028023
0.077
plac8l1
-0.048
LAMP5
0.076
nmt1b
-0.047
krt8
0.076
si:ch211-207c6.2
-0.046
si:ch211-59d8.2
0.075
gpx1a
-0.043
jpt1b
0.074
si:ch211-227m13.1
-0.043
krt18a.1
0.074
tmod4
-0.040
hs6st3b
0.074
tmem14ca
-0.040
sash1a
0.074
add2
-0.038
si:dkeyp-82b4.3
0.073
uros
-0.037
ntn4
0.072
klf1
-0.037
pfn2
0.071
hbbe3
-0.037
znf1113
0.070
ucp3
-0.037
ppiaa
0.070
hbae5
-0.036
marcksl1b
0.070
slc11a2
-0.036
rhoaa
0.069
rhd
-0.035