Daniocell
kidins220a (epidermis)
kinase D-interacting substrate 220a
ZFIN
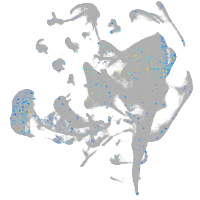
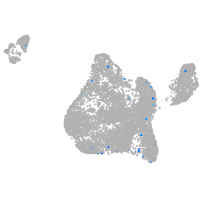
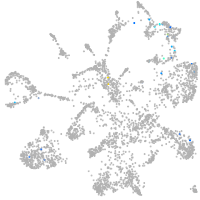
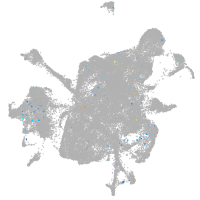
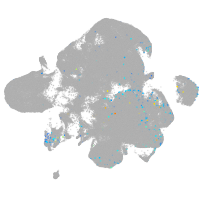
Gene expression UMAP
Display:
Expression
Stage
Other cell groups
all cells
blastomeres
PGCs
endoderm
axial mesoderm
muscle
mural cells /
non-skeletal muscle
mesenchyme
hematopoietic /
vasculature
pronephros
neural
spinal cord / glia
eye
taste / olfactory
otic / lateral line
epidermis
periderm
fin
ionocytes / mucous
pigment cells
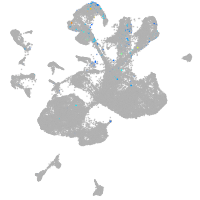
Expression by stage/cluster
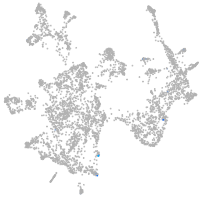
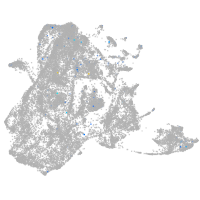
Correlated gene expression
Positive correlation
Negative correlation
Gene
r
Gene
r
CR354395.1
0.287
hmga1a
-0.041
LOC108179280
0.206
h2afvb
-0.036
LO018205.3
0.199
h3f3d
-0.035
FP102171.1
0.191
ptmab
-0.035
CABZ01086574.1
0.188
hmgn6
-0.035
fmnl1a
0.168
smarce1
-0.035
si:ch73-196l6.5
0.160
sec61b
-0.034
si:dkey-156k2.7
0.153
si:ch211-222l21.1
-0.033
si:dkey-196n19.2
0.153
nucks1a
-0.033
kynu
0.139
snrpf
-0.033
LOC100007738
0.125
snrpg
-0.033
LOC101885829
0.125
dad1
-0.032
abi3bpa
0.121
ssr4
-0.032
pde4bb
0.116
tpm4a
-0.032
evx1
0.111
fkbp9
-0.031
LOC100330321
0.108
srsf3b
-0.031
kcnk10b
0.106
hnrnpa0b
-0.031
LOC108182213
0.105
rpl23
-0.031
porcn
0.102
sap18
-0.031
CR678435.1
0.101
ptges3b
-0.030
si:ch73-52p7.1
0.101
slc39a7
-0.030
LOC103911060
0.099
rpl13
-0.030
ttyh2l
0.097
arf5
-0.030
fgf1a
0.096
rpl7
-0.030
gpr12
0.093
si:ch211-276i12.11
-0.029
itgb7
0.093
rpl28
-0.029
c1ql3a
0.091
ywhae1
-0.029
apba2a
0.090
si:ch73-281n10.2
-0.029
slc12a8
0.089
ilf2
-0.029
BX663612.1
0.089
rpn1
-0.029
LOC103909381.1
0.086
arpc5a
-0.029
LOC101886390
0.086
hmgb3a
-0.029
XLOC-039765
0.085
hmgb2b
-0.028
CR589947.3
0.082
cd151l
-0.028
tspan34
0.081
rps12
-0.028