Daniocell
kbtbd7 (glial cells / spinal cord)
kelch repeat and BTB (POZ) domain containing 7
ZFIN
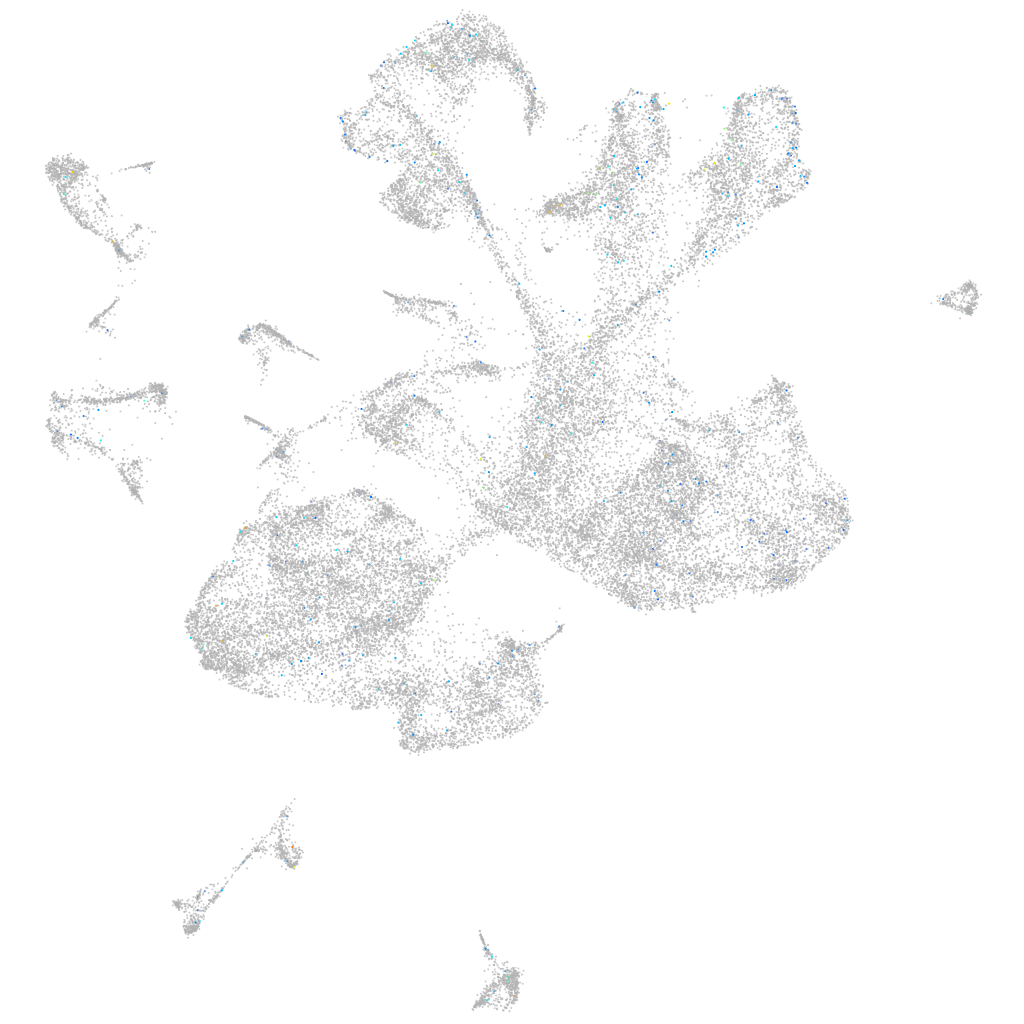
Gene expression UMAP
Display:
Expression
Stage
Other cell groups
all cells
blastomeres
PGCs
endoderm
axial mesoderm
muscle
mural cells /
non-skeletal muscle
mesenchyme
hematopoietic /
vasculature
pronephros
neural
spinal cord / glia
eye
taste / olfactory
otic / lateral line
epidermis
periderm
fin
ionocytes / mucous
pigment cells
Expression by stage/cluster
Correlated gene expression
Positive correlation
Negative correlation
Gene
r
Gene
r
si:dkey-23c22.7
0.089
XLOC-003690
-0.036
CU207343.2
0.070
rpl23
-0.034
zgc:136683
0.063
hmgb2a
-0.034
LOC103909037.1
0.059
rplp2l
-0.033
BX569779.1
0.059
rplp1
-0.033
meltf
0.058
rps24
-0.032
CU929150.1
0.056
her15.1
-0.031
BX547993.2
0.055
rpl10a
-0.029
XLOC-017482
0.055
rpl28
-0.028
BX248089.1
0.055
rps13
-0.028
CABZ01069436.1
0.055
rps23
-0.028
clic3
0.055
rpl37
-0.027
LOC100334439
0.053
rpl13
-0.027
XLOC-008680
0.052
rps20
-0.027
si:dkey-283j8.1
0.052
pcna
-0.026
LOC108191543
0.051
rpl12
-0.026
LOC100537138
0.050
cldn5a
-0.026
bsnd
0.050
rps19
-0.026
BX324227.1
0.049
tuba8l
-0.026
stx1b
0.047
XLOC-003692
-0.026
CR954285.1
0.047
XLOC-003689
-0.025
atp6v1e1b
0.047
stmn1a
-0.025
XLOC-002638
0.047
rpl11
-0.025
rnasekb
0.046
slbp
-0.025
sncb
0.046
si:dkey-151g10.6
-0.025
rgs13
0.046
her2
-0.025
si:ch211-266k2.1
0.045
hmgb2b
-0.025
tmtopsa
0.045
rrm2
-0.025
XLOC-023372
0.045
abhd6a
-0.025
LOC103909419
0.045
nutf2l
-0.025
pacsin1a
0.045
dut
-0.024
ywhag2
0.045
chaf1a
-0.024
LOC101886724
0.044
faua
-0.024
cplx2
0.044
rps12
-0.024
LOC101885837
0.044
rpl35a
-0.024