Daniocell
kat6b (mesenchyme)
K(lysine) acetyltransferase 6B
ZFIN
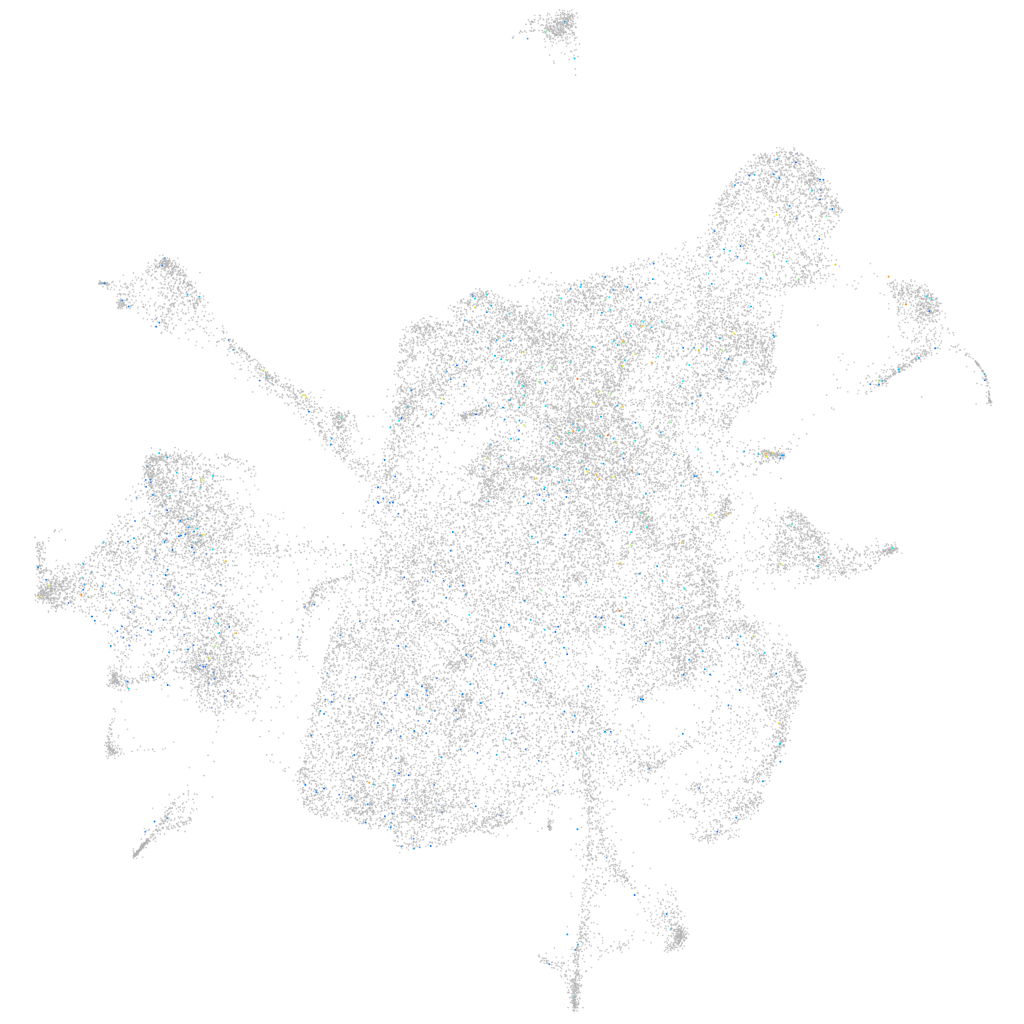
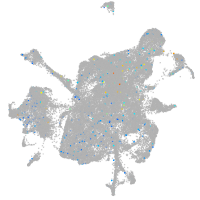
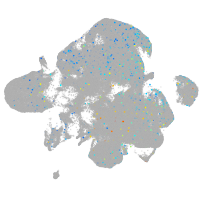
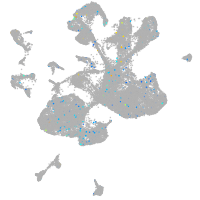
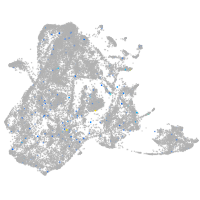
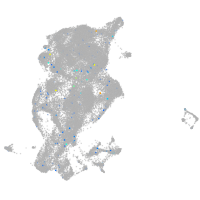
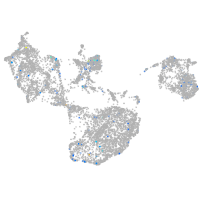
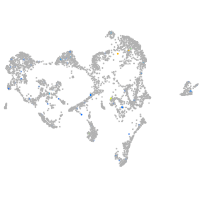
Gene expression UMAP
Display:
Expression
Stage
Other cell groups
all cells
blastomeres
PGCs
endoderm
axial mesoderm
muscle
mural cells /
non-skeletal muscle
mesenchyme
hematopoietic /
vasculature
pronephros
neural
spinal cord / glia
eye
taste / olfactory
otic / lateral line
epidermis
periderm
fin
ionocytes / mucous
pigment cells
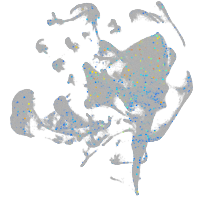
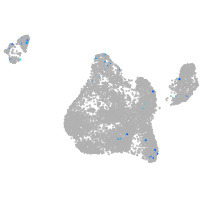
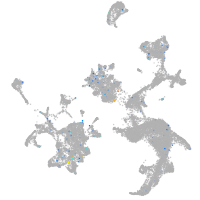
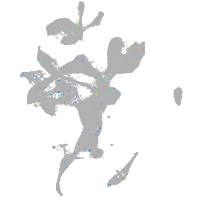
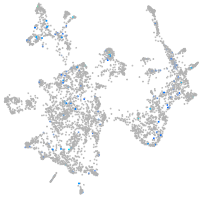
Expression by stage/cluster
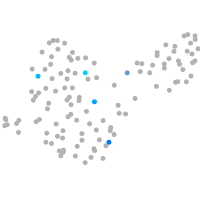
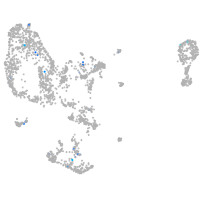
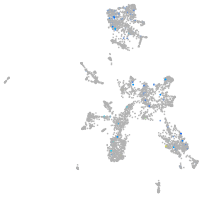
Correlated gene expression
Positive correlation
Negative correlation
Gene
r
Gene
r
BX908780.1
0.074
si:dkey-151g10.6
-0.028
AL935198.2
0.071
rpl39
-0.017
CABZ01007816.1
0.070
rps20
-0.017
si:ch211-197g15.10
0.056
lin28a
-0.016
si:ch211-67n3.9
0.055
si:ch211-217k17.7
-0.016
BX005153.1
0.055
npm1a
-0.016
LOC103909395
0.054
mak16
-0.015
BX936298.2
0.053
rpl38
-0.014
si:dkey-98j1.5
0.052
hbbe3
-0.014
BX510324.1
0.051
polr1d
-0.014
rsph14
0.051
cthrc1a
-0.014
FO834828.1
0.047
lyar
-0.014
BX908744.2
0.046
aamp
-0.014
BX957325.1
0.046
thy1
-0.014
si:ch211-125c23.3
0.045
psmg2
-0.013
ido1
0.044
mrps14
-0.013
CR450749.2
0.044
rplp1
-0.013
BX088728.1
0.044
pak1ip1
-0.013
XLOC-008185
0.042
taf1b
-0.013
map3k8
0.042
pus3
-0.013
taar19c
0.042
rps28
-0.013
XLOC-044318
0.041
tomm40
-0.013
LOC110438435
0.041
rpl36a
-0.013
si:ch1073-110a20.3
0.041
dhrs12
-0.012
LOC108181595
0.040
rcl1
-0.012
LOC110439790
0.039
pabpc1a
-0.012
zgc:136605
0.039
tjp2b
-0.012
AL928685.1
0.038
cdca5
-0.012
si:ch73-184c24.1
0.037
polr2h
-0.012
BX323800.1
0.037
ccdc58
-0.012
LOC110437792
0.037
rps24
-0.012
tnfsf14
0.036
mrpl35
-0.012
hspb6
0.036
eme1
-0.012
LOC101886071
0.036
mob3a
-0.012
XLOC-023730
0.036
eif4ebp1
-0.012