Daniocell
kansl2 (fin)
KAT8 regulatory NSL complex subunit 2
ZFIN
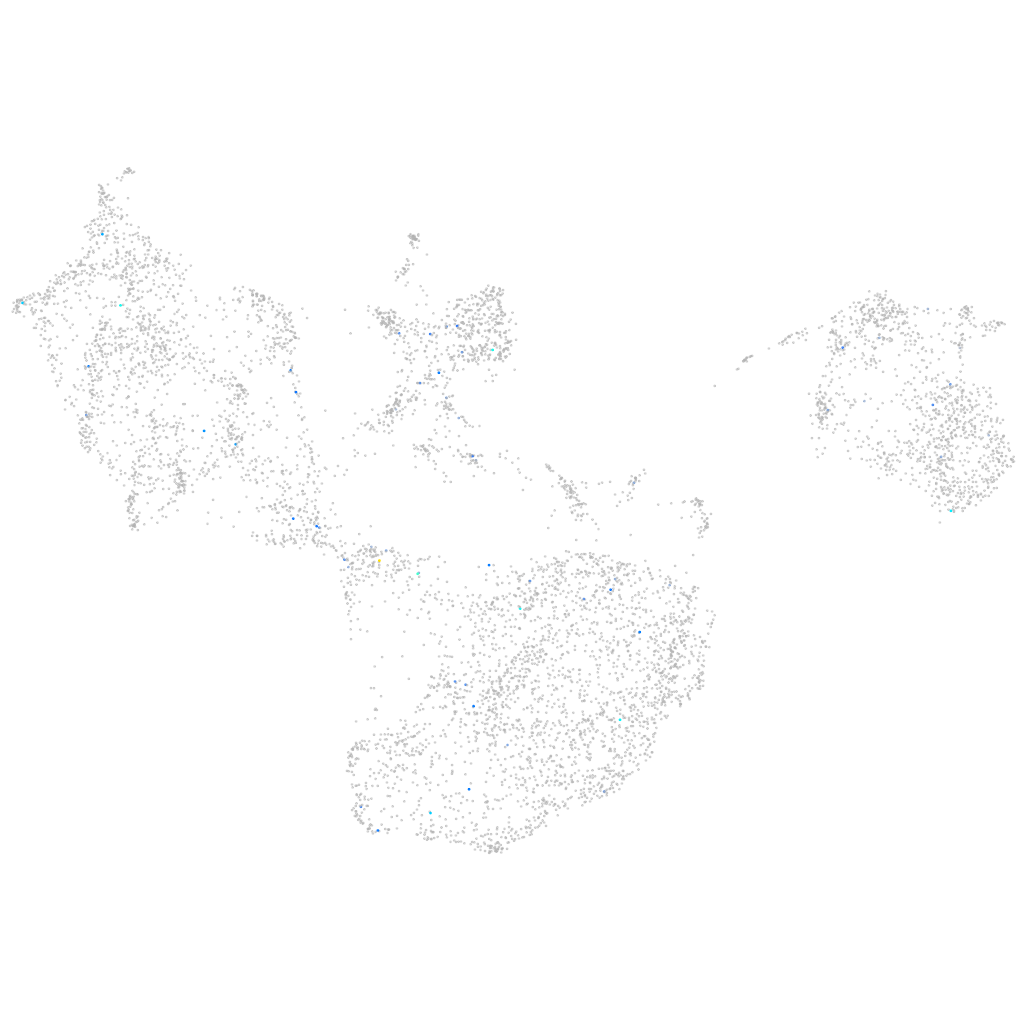
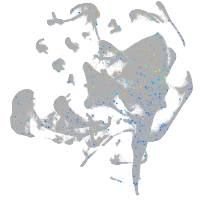
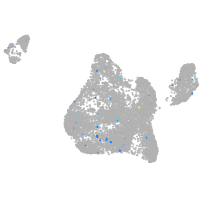
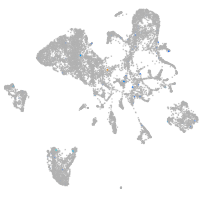
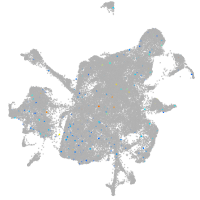
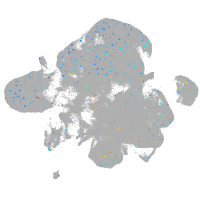
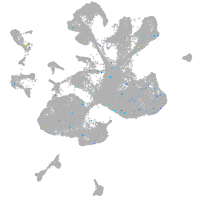
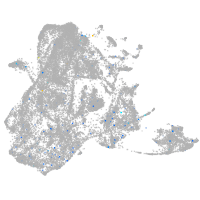
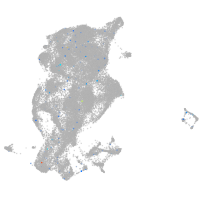
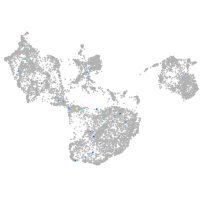
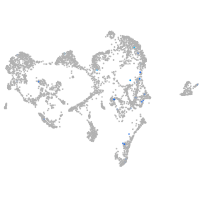
Gene expression UMAP
Display:
Expression
Stage
Other cell groups
all cells
blastomeres
PGCs
endoderm
axial mesoderm
muscle
mural cells /
non-skeletal muscle
mesenchyme
hematopoietic /
vasculature
pronephros
neural
spinal cord / glia
eye
taste / olfactory
otic / lateral line
epidermis
periderm
fin
ionocytes / mucous
pigment cells
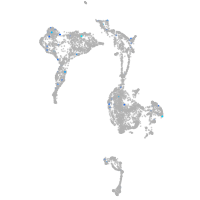
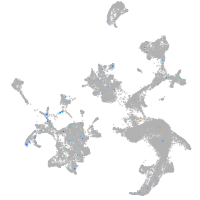
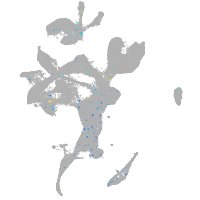
Expression by stage/cluster
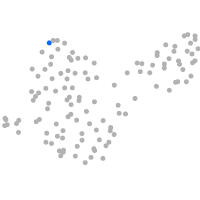
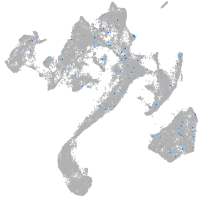
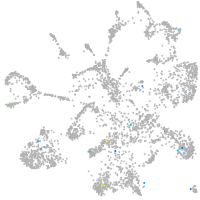
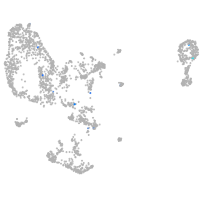
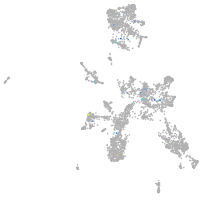
Correlated gene expression
Positive correlation
Negative correlation
Gene
r
Gene
r
CABZ01044048.1
0.336
arl5c
-0.029
CU104782.1
0.185
drg2
-0.028
CR848840.1
0.185
gamt
-0.028
sgsm3
0.173
dars
-0.027
LOC100537263
0.168
rps8a
-0.027
zgc:73226
0.167
gstt1a
-0.027
fsip1
0.163
nme2b.1
-0.026
LOC110439844
0.160
cnn3a
-0.026
XLOC-033093
0.146
cxcl14
-0.026
rad51d
0.145
XLOC-010897
-0.026
LOC100149669
0.144
tjp3
-0.026
LOC100537297
0.142
mgst1.2
-0.025
XLOC-027664
0.141
mmp14a
-0.025
RF00548
0.139
gas6
-0.025
LOC108180103
0.130
cyp26c1
-0.025
odf2a
0.126
ing4
-0.025
mycbpap
0.122
yipf5
-0.025
si:ch211-113a14.19
0.121
si:dkey-112e7.2
-0.024
bmp1b
0.119
gkap1
-0.024
LOC108190763
0.118
eif4ebp3
-0.024
FO834903.1
0.115
cry-dash
-0.024
pcdh1g3
0.115
arrdc3b
-0.024
tmem130
0.114
csnk2b
-0.024
zgc:171711
0.114
adi1
-0.024
rft1
0.113
eef1a1l1
-0.024
CR847887.1
0.113
fosl1a
-0.023
AL954327.1
0.113
fam102ab
-0.023
nphs1
0.113
glrx
-0.023
cbln11
0.112
bloc1s6
-0.023
mastl
0.112
txndc15
-0.023
zgc:174164
0.108
fam210b
-0.023
trim46a
0.107
lxn
-0.023
NC-002333.23
0.107
zgc:112982
-0.023
foxd3
0.105
eif4e2rs1
-0.023
LOC100537733
0.105
smad3a
-0.022