Daniocell
jtb (taste / olfactory)
jumping translocation breakpoint
ZFIN
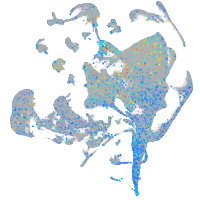
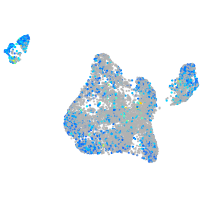
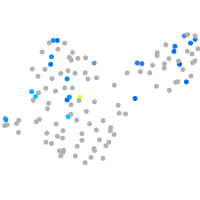
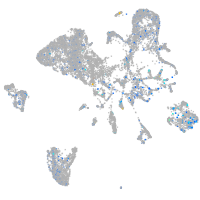
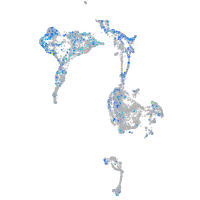
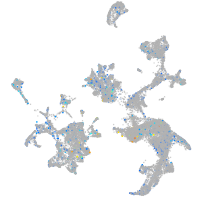
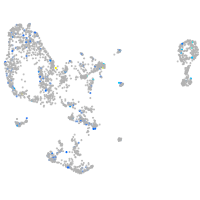
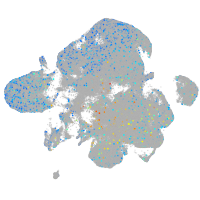
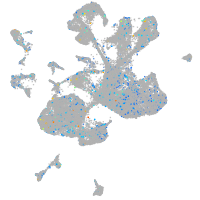
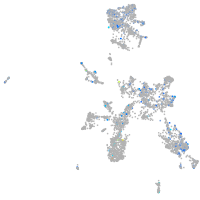
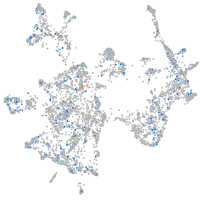
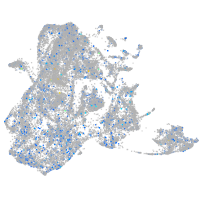
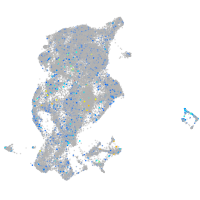
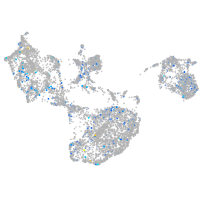
Gene expression UMAP
Display:
Expression
Stage
Other cell groups
all cells
blastomeres
PGCs
endoderm
axial mesoderm
muscle
mural cells /
non-skeletal muscle
mesenchyme
hematopoietic /
vasculature
pronephros
neural
spinal cord / glia
eye
taste / olfactory
otic / lateral line
epidermis
periderm
fin
ionocytes / mucous
pigment cells
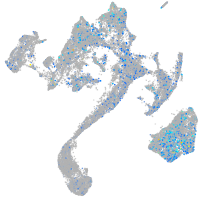
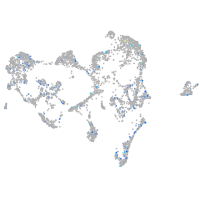
Expression by stage/cluster
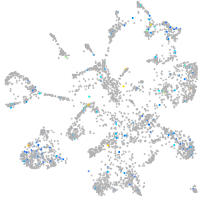
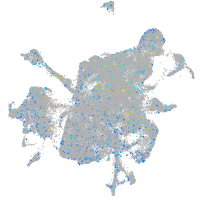
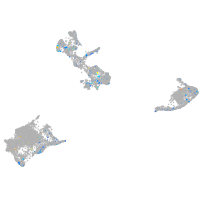
Correlated gene expression
Positive correlation
Negative correlation
Gene
r
Gene
r
CU570781.1
0.237
hbbe1.1
-0.048
urp2
0.237
rpl29
-0.041
si:dkey-260g12.1
0.191
pvalb1
-0.041
taar20u
0.185
tmem218
-0.040
LO018107.1
0.165
tmsb4x
-0.040
LOC103910276
0.165
hbae1.1
-0.040
CU929145.1
0.165
si:ch211-81a5.5
-0.039
si:dkeyp-93a5.2
0.165
myl1
-0.038
LOC103910192
0.165
tfap2e
-0.038
si:ch73-106l15.4
0.165
ccar2
-0.038
si:ch73-379f5.5
0.163
rassf4a
-0.037
tac4
0.162
aig1
-0.037
si:dkey-122c11.1
0.158
pax6a
-0.036
LOC110438591
0.156
uba52
-0.036
eva1c
0.154
cnot4b
-0.036
LOC100538255
0.153
col1a1a
-0.036
zgc:158445
0.152
hbbe1.3
-0.036
zgc:172339
0.143
hmgxb4a
-0.036
cdx1a
0.141
rps25
-0.035
LOC110438090
0.141
rab6ba
-0.035
CABZ01060491.1
0.131
wdr60
-0.035
CABZ01114105.1
0.129
nmt1a
-0.035
si:ch211-165d12.4
0.128
nme2b.2
-0.035
CABZ01025311.1
0.128
CABZ01055306.1
-0.035
si:ch211-160d20.5
0.128
si:ch211-10a23.2
-0.035
LOC108191476
0.124
pbx3b
-0.035
gata1a
0.123
myl13
-0.034
BX510989.1
0.121
pvalb4
-0.034
XLOC-017089
0.121
rps28
-0.034
XLOC-024447
0.118
hpcal4
-0.033
CABZ01112864.1
0.115
relt
-0.033
pde6ga
0.115
atp2a1
-0.033
btk
0.112
CU467823.1
-0.033
si:dkey-237m9.1
0.111
mylpfb
-0.033
si:ch73-208g10.1
0.111
map6b
-0.033