Daniocell
jarid2a (periderm)
"jumonji, AT rich interactive domain 2a"
ZFIN
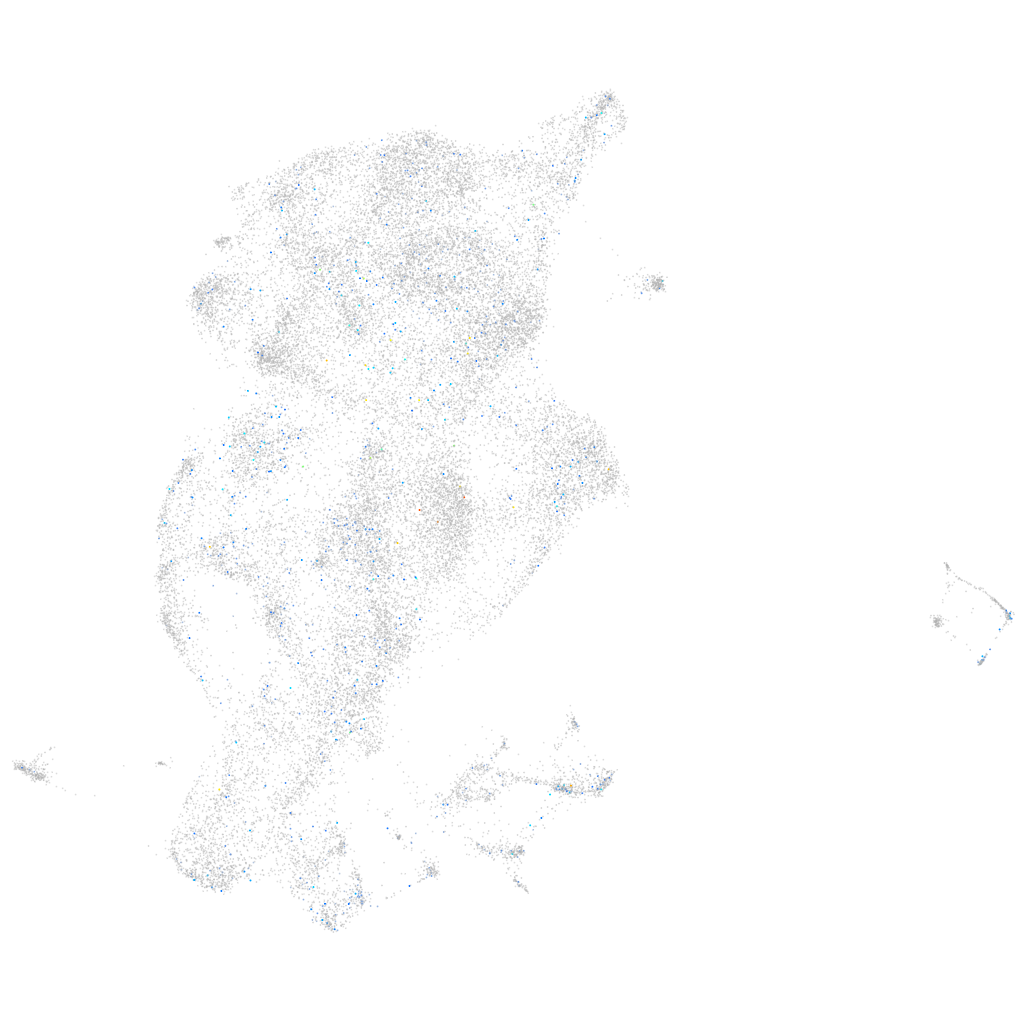
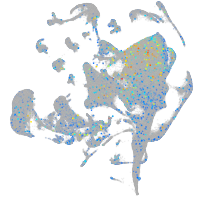
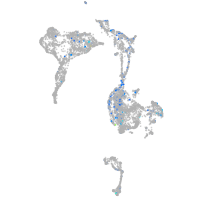
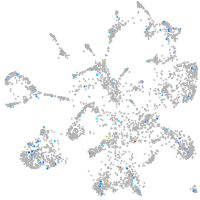
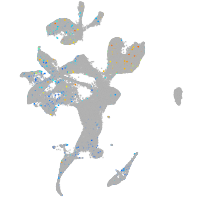
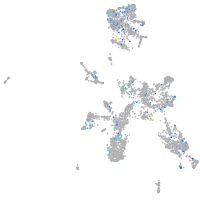
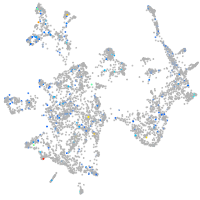
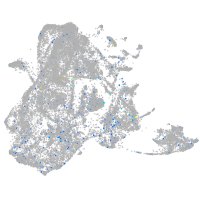
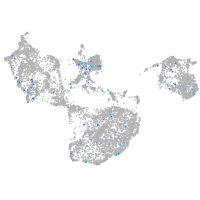
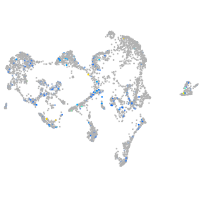
Gene expression UMAP
Display:
Expression
Stage
Other cell groups
all cells
blastomeres
PGCs
endoderm
axial mesoderm
muscle
mural cells /
non-skeletal muscle
mesenchyme
hematopoietic /
vasculature
pronephros
neural
spinal cord / glia
eye
taste / olfactory
otic / lateral line
epidermis
periderm
fin
ionocytes / mucous
pigment cells
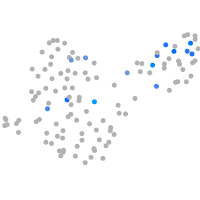
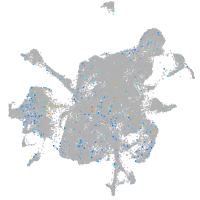
Expression by stage/cluster
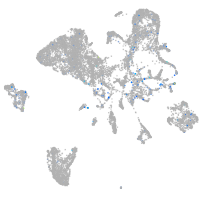
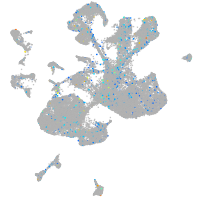
Correlated gene expression
Positive correlation
Negative correlation
Gene
r
Gene
r
LOC101882926
0.131
s100a10b
-0.048
VSTM2A
0.109
si:ch211-195b11.3
-0.046
LOC103912056
0.099
cfl1l
-0.045
BX510319.1
0.098
rpl39
-0.041
fancm
0.096
cyt1
-0.041
XLOC-002671
0.094
icn2
-0.040
si:cabz01036022.1
0.094
krt4
-0.039
XLOC-041394
0.092
rps24
-0.039
lmx1al
0.090
s100w
-0.038
LOC103911742
0.084
rps7
-0.038
XLOC-013311
0.084
icn
-0.037
LOC108191357
0.084
si:dkey-16p21.8
-0.036
CR749763.2
0.084
anxa1a
-0.036
BX649423.2
0.082
ahcy
-0.035
kitb
0.080
rpl12
-0.035
LOC108183319
0.080
rps21
-0.035
pex5la
0.076
rps13
-0.034
FO818719.1
0.076
anxa2a
-0.034
shisal1b
0.074
rpl35
-0.034
LOC110438044
0.073
rps15a
-0.034
LOC108181656
0.073
rpl10
-0.033
slc26a4
0.072
pycard
-0.033
pcdh1g13
0.071
faua
-0.033
ctss1
0.069
atp5mc3b
-0.032
BX119926.1
0.068
s100v2
-0.031
XLOC-028807
0.067
romo1
-0.031
si:ch211-180f4.1
0.067
glo1
-0.031
LOC100003040
0.067
cyt1l
-0.031
pappab
0.067
rpl19
-0.030
rxfp2l
0.067
rps20
-0.029
kcnq3
0.065
rps12
-0.029
c1ql1a
0.065
rpl7
-0.029
XPO5
0.065
zgc:114188
-0.029
si:dkey-231j24.3
0.065
si:dkey-151g10.6
-0.029
LOC100002266
0.064
eef1b2
-0.029