Daniocell
itpka (blastomeres)
inositol-trisphosphate 3-kinase A
ZFIN
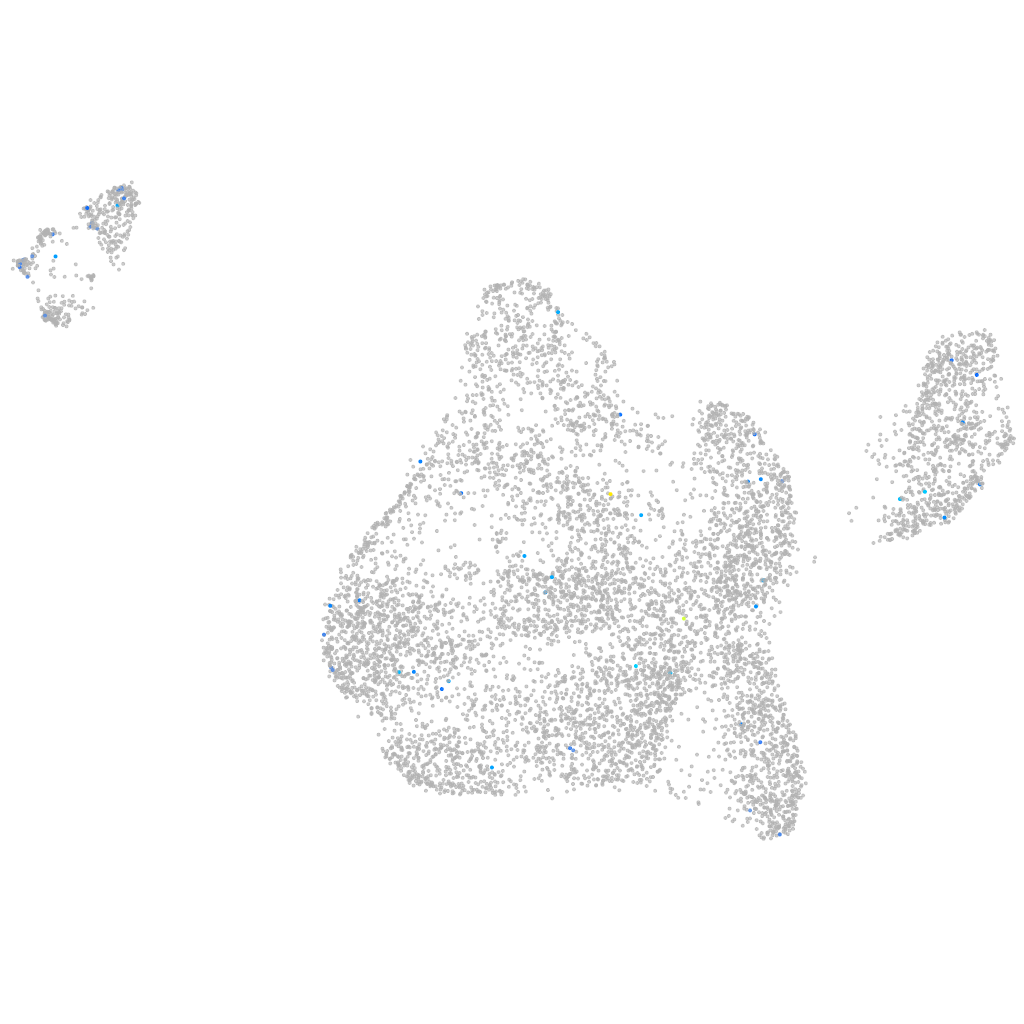
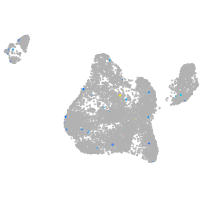
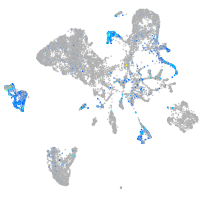
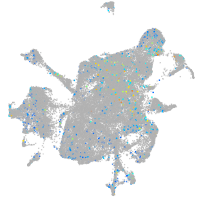
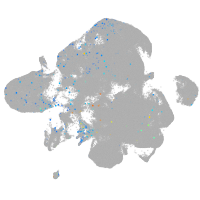
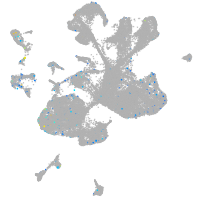
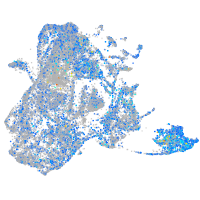
Gene expression UMAP
Display:
Expression
Stage
Other cell groups
all cells
blastomeres
PGCs
endoderm
axial mesoderm
muscle
mural cells /
non-skeletal muscle
mesenchyme
hematopoietic /
vasculature
pronephros
neural
spinal cord / glia
eye
taste / olfactory
otic / lateral line
epidermis
periderm
fin
ionocytes / mucous
pigment cells
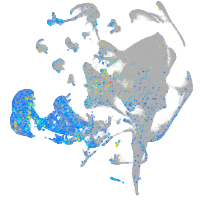
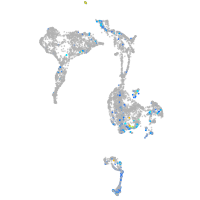
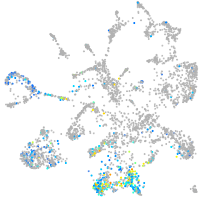
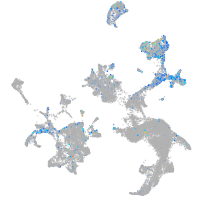
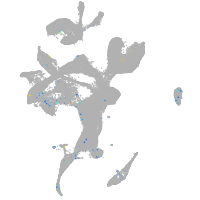
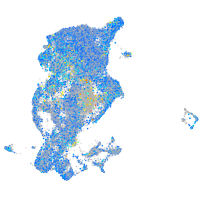
Expression by stage/cluster
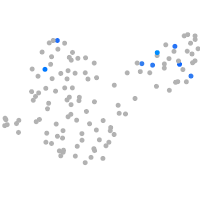
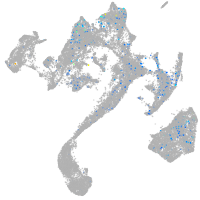
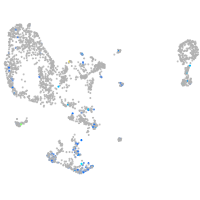
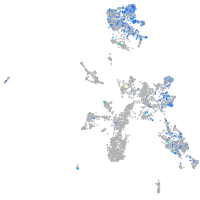
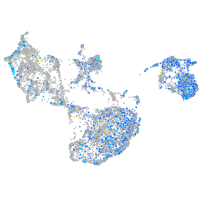
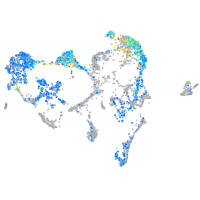
Correlated gene expression
Positive correlation
Negative correlation
Gene
r
Gene
r
LOC100535061
0.201
anp32b
-0.046
itih1
0.179
rps15a
-0.046
LOC101886779
0.176
eef1a1l1
-0.042
sult1st3
0.171
dynll1
-0.042
LOC110440040
0.162
khdrbs1a
-0.041
XLOC-035776
0.157
cirbpb
-0.040
pik3cb
0.152
aldob
-0.040
LOC103912010
0.149
cnbpa
-0.038
si:dkey-102f14.7
0.147
anp32e
-0.038
XLOC-032764
0.146
rps21
-0.037
CU464087.1
0.145
rpl36a
-0.037
BX530064.2
0.143
tp53inp2
-0.037
BX950205.3
0.143
hmga1a
-0.037
wnt3a
0.141
csnk2a1
-0.036
BX769173.1
0.136
rps20
-0.036
GRIK2
0.135
rpl22
-0.035
irx5b
0.135
rpl6
-0.035
chrm4a
0.130
apoeb
-0.035
si:dkey-26c10.5
0.126
hnrnpa1b
-0.035
si:ch211-202p1.5
0.126
rps3a
-0.035
fanca
0.126
rps25
-0.034
aasdh
0.125
si:ch73-1a9.3
-0.034
LOC101886530
0.123
si:rp71-45k5.4
-0.034
tfap2e
0.122
bcas2
-0.034
rspo2
0.120
hnrnpa0b
-0.034
foxe3
0.119
hmgn6
-0.033
LOC101886255
0.118
taf15
-0.033
si:ch211-274k16.2
0.113
srsf5a
-0.033
fam117ba
0.113
stm
-0.033
CU856621.2
0.111
naa10
-0.032
itgb3b
0.110
rpl19
-0.032
afp4
0.110
rplp2l
-0.032
LOC110439787
0.109
rpl5b
-0.032
penka
0.106
rps7
-0.032
zmp:0000001073
0.104
marcksl1b
-0.032