Daniocell
itfg2 (axial mesoderm)
integrin alpha FG-GAP repeat containing 2
ZFIN
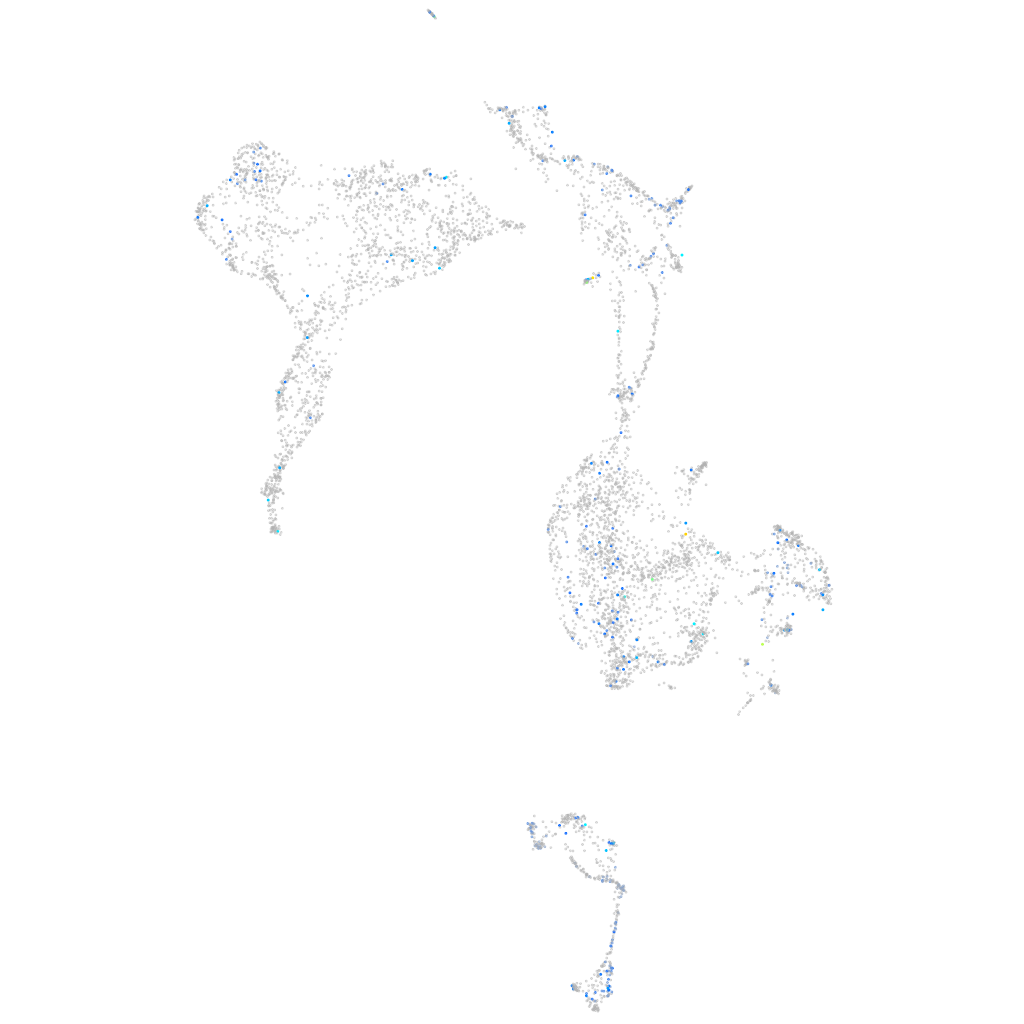
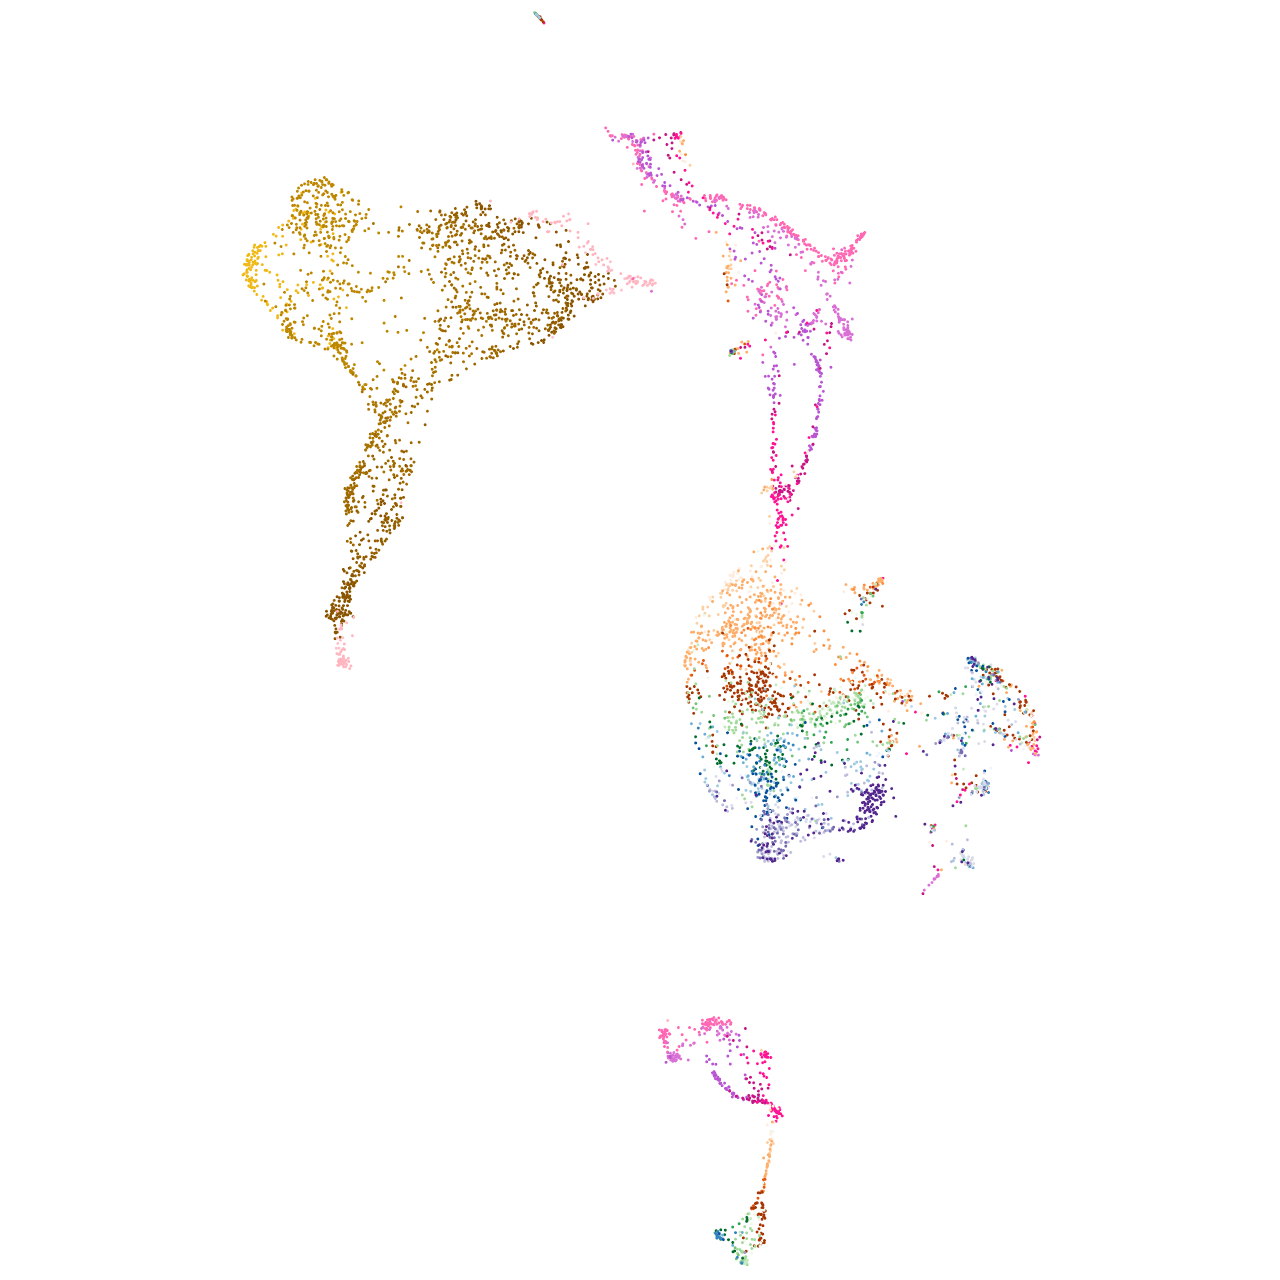
Gene expression UMAP
Display:
Expression
Stage
Other cell groups
all cells
blastomeres
PGCs
endoderm
axial mesoderm
muscle
mural cells /
non-skeletal muscle
mesenchyme
hematopoietic /
vasculature
pronephros
neural
spinal cord / glia
eye
taste / olfactory
otic / lateral line
epidermis
periderm
fin
ionocytes / mucous
pigment cells
Expression by stage/cluster
Correlated gene expression
Positive correlation
Negative correlation
Gene
r
Gene
r
si:ch211-232d10.1
0.186
NC-002333.4
-0.086
CR377211.1
0.157
top1l
-0.076
si:dkeyp-80d11.10
0.150
ptmab
-0.076
LOC110439827
0.147
brd3a
-0.072
si:dkey-165e24.1
0.145
marcksb
-0.071
myct1a
0.141
stm
-0.071
XLOC-002188
0.137
safb
-0.070
LOC110439590
0.136
srrm1
-0.069
tekt1
0.134
hmga1a
-0.068
CR790362.1
0.132
ddx18
-0.067
sb:cb470
0.125
hnrnpa0b
-0.066
pik3cg
0.120
hnrnpl
-0.064
hopx
0.119
pabpc1a
-0.063
si:ch211-132g1.4
0.119
hnrnpa1b
-0.063
lyve1b
0.117
ncl
-0.063
serpinb1
0.117
snrnp70
-0.063
si:dkey-33i11.9
0.114
hnrnpub
-0.063
cracr2b
0.113
hnrnpa1a
-0.062
cst14a.2
0.113
fbl
-0.062
rgs2
0.112
seta
-0.062
s100v2
0.111
nucks1a
-0.062
zgc:56493
0.110
srsf3a
-0.062
si:dkey-222f8.3
0.110
si:ch211-152c2.3
-0.062
si:dkey-248g15.3
0.109
si:ch211-288g17.3
-0.062
rasd1
0.108
khdrbs1b
-0.062
slc16a12b
0.108
tardbp
-0.062
LOC103909376
0.108
ndr2
-0.061
svopl
0.107
cdk2ap2
-0.061
snapin
0.107
chrd
-0.060
LOC103911920
0.107
foxa
-0.060
isca2
0.107
acin1b
-0.060
il15
0.106
anp32e
-0.060
scgn
0.106
ppig
-0.060
zgc:123295
0.106
hnrnpl2
-0.059
lepb
0.105
szrd1
-0.059