Daniocell
itcha (blastomeres)
itchy E3 ubiquitin protein ligase a
ZFIN
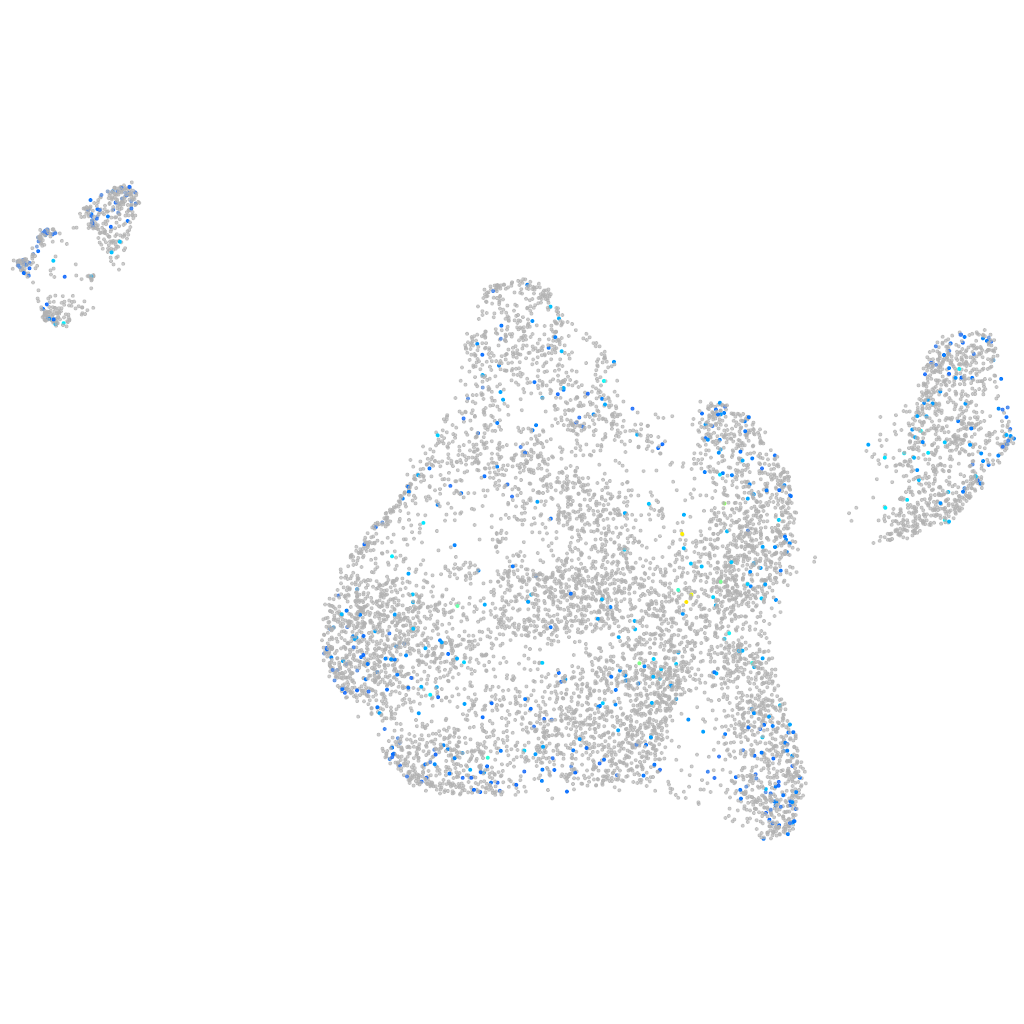
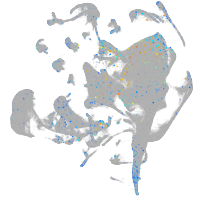
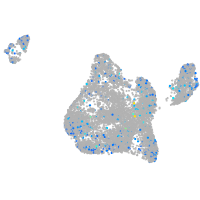
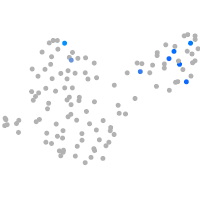
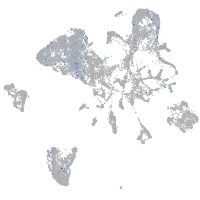
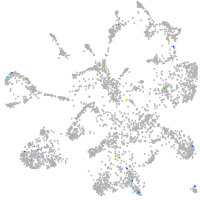
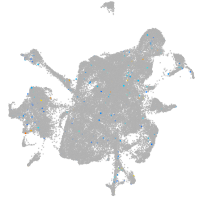
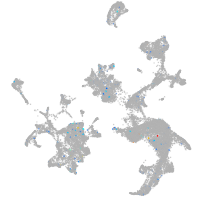
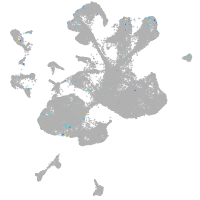
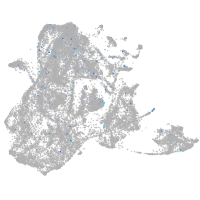
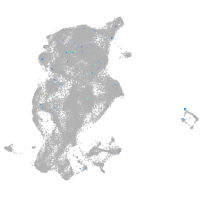
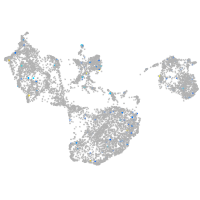
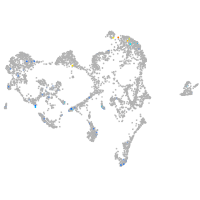
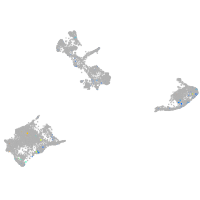
Gene expression UMAP
Display:
Expression
Stage
Other cell groups
all cells
blastomeres
PGCs
endoderm
axial mesoderm
muscle
mural cells /
non-skeletal muscle
mesenchyme
hematopoietic /
vasculature
pronephros
neural
spinal cord / glia
eye
taste / olfactory
otic / lateral line
epidermis
periderm
fin
ionocytes / mucous
pigment cells
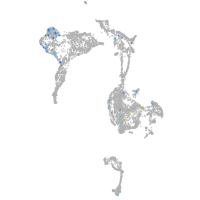
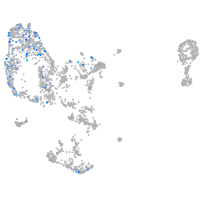
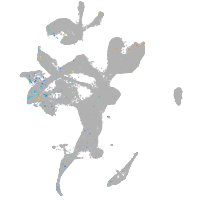
Expression by stage/cluster
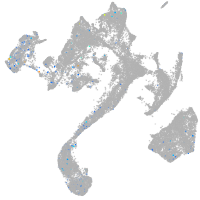
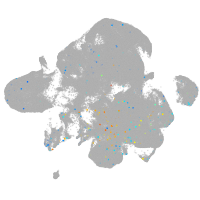
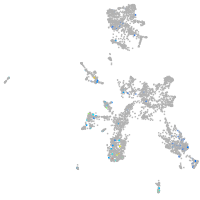
Correlated gene expression
Positive correlation
Negative correlation
Gene
r
Gene
r
sdsl
0.081
hmgn2
-0.063
gtf2a1
0.079
ptmab
-0.058
LOC108190601
0.079
si:ch73-1a9.3
-0.053
CABZ01056843.1
0.074
eef1a1l1
-0.051
LOC100537317
0.073
NC-002333.4
-0.050
cbln11
0.073
hspb1
-0.049
si:ch211-210b2.3
0.072
si:ch211-152c2.3
-0.049
LOC110439324
0.071
rps4x
-0.048
CABZ01044764.2
0.070
nop53
-0.047
ppp1r2
0.069
ube2c
-0.046
ccna1
0.068
rpl7a
-0.046
LOC101886104
0.067
si:ch211-222l21.1
-0.046
LOC100534675
0.067
sox2
-0.046
arhgef18a
0.067
marcksl1b
-0.044
CT583690.1
0.066
nop2
-0.043
cav1
0.065
apoc1
-0.042
nanos2
0.065
rplp1
-0.042
cyp2r1
0.065
dynll1
-0.041
tnfaip1
0.064
rpl27
-0.041
XLOC-036408
0.064
mt-co1
-0.041
zgc:100951
0.064
hmgn6
-0.040
epcam
0.063
rps3a
-0.040
si:ch73-233f7.1
0.063
crabp2b
-0.039
lamp2
0.063
hnrnpa0b
-0.039
glsl
0.062
rps16
-0.039
ptafr
0.062
hmga1a
-0.039
wif1
0.062
cdx4
-0.038
zfand5b
0.062
anp32e
-0.038
ctsba
0.062
rpl13a
-0.038
ofd1
0.062
rpl19
-0.038
CU104743.1
0.062
rpl7
-0.038
inka1a
0.062
cdkn1cb
-0.038
LOC101886691
0.062
si:dkey-56m19.5
-0.037
mkrn4
0.062
mt-cyb
-0.037
spink2.1
0.061
CR383676.1
-0.037