
immunoglobulin superfamily containing leucine-rich repeat 2
ZFIN 
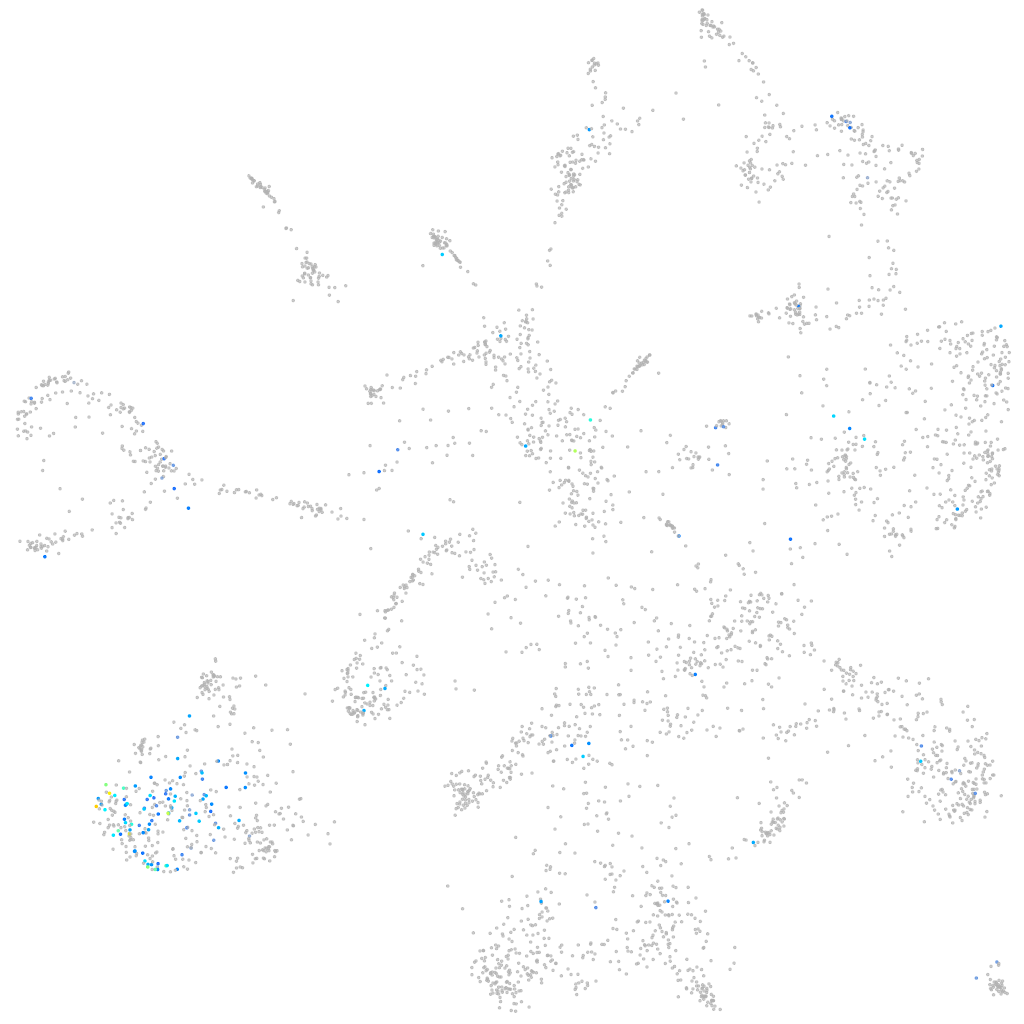
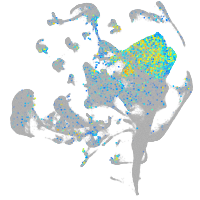
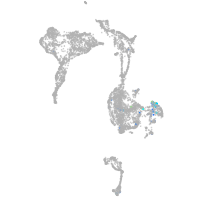
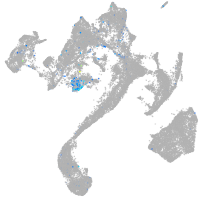
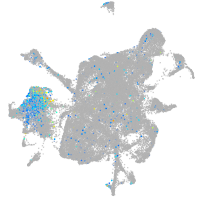
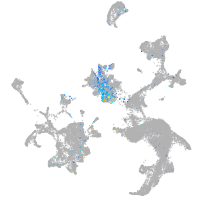
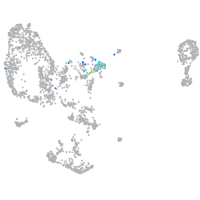
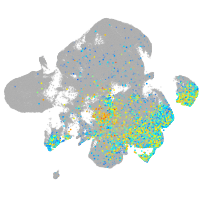
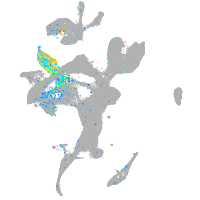
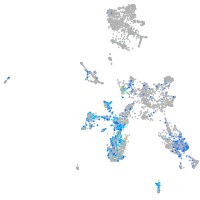
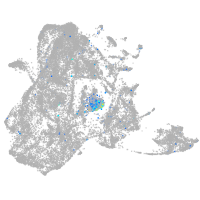
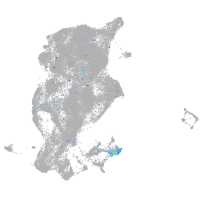
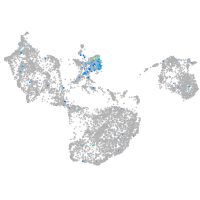
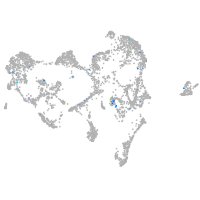
Gene expression UMAP


Expression by stage/cluster
Correlated gene expression
| Positive correlation | Negative correlation | ||
| Gene | r | Gene | r |
| xpr1a | 0.463 | rpl14 | -0.079 |
| nmnat2 | 0.341 | rps16 | -0.073 |
| nlgn3a | 0.338 | rpl3 | -0.070 |
| stmn1b | 0.336 | rps18 | -0.069 |
| sncb | 0.333 | rplp1 | -0.066 |
| gng3 | 0.329 | rpsa | -0.063 |
| mllt11 | 0.328 | rps10 | -0.061 |
| fxyd6 | 0.320 | rps11 | -0.061 |
| ppp1r14ba | 0.316 | rpl15 | -0.058 |
| tuba1c | 0.314 | rps2 | -0.057 |
| rtn1b | 0.313 | si:ch211-286o17.1 | -0.056 |
| stmn2a | 0.311 | pmp22a | -0.054 |
| zgc:65894 | 0.310 | rps29 | -0.054 |
| elavl3 | 0.308 | tmem88b | -0.053 |
| gpm6aa | 0.299 | rpl39 | -0.053 |
| gpm6ab | 0.292 | rps9 | -0.053 |
| myt1la | 0.287 | rpl5a | -0.053 |
| rtn1a | 0.285 | rps24 | -0.052 |
| id4 | 0.283 | rpl36a | -0.052 |
| stxbp1a | 0.282 | rps27a | -0.051 |
| tmsb | 0.282 | rpl9 | -0.051 |
| elmod1 | 0.282 | rpl24 | -0.050 |
| evlb | 0.280 | rps15 | -0.050 |
| kif3cb | 0.279 | rpl4 | -0.050 |
| nova2 | 0.278 | rplp2 | -0.049 |
| gabrb4 | 0.277 | tspan7 | -0.049 |
| st8sia5 | 0.274 | rpl26 | -0.048 |
| syngr3a | 0.274 | uba52 | -0.048 |
| nsg2 | 0.273 | rpl36 | -0.048 |
| syn2a | 0.273 | rps8a | -0.048 |
| nova1 | 0.273 | krt8 | -0.048 |
| ywhag2 | 0.272 | rps3 | -0.047 |
| elavl4 | 0.268 | rpl34 | -0.047 |
| olfm1b | 0.267 | rras | -0.047 |
| sv2a | 0.267 | rps13 | -0.047 |