Daniocell
irak4 (blastomeres)
interleukin-1 receptor-associated kinase 4
ZFIN
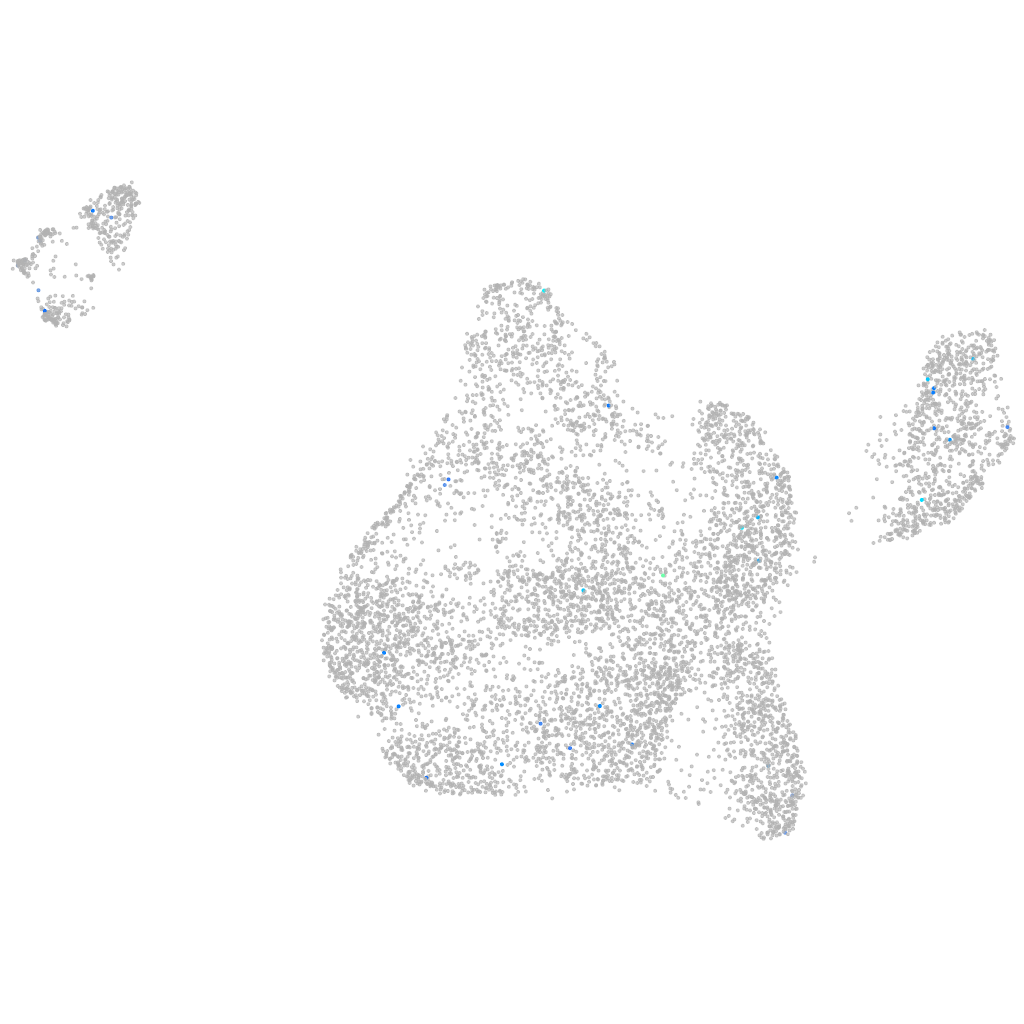
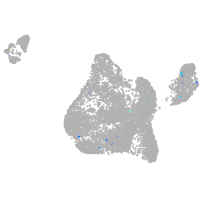
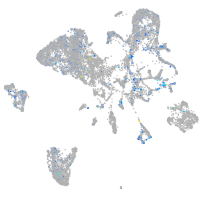
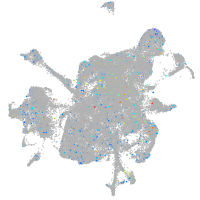
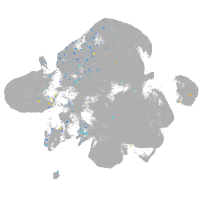
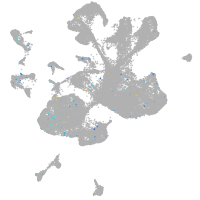
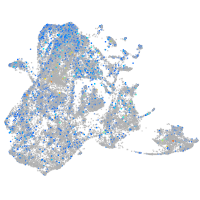
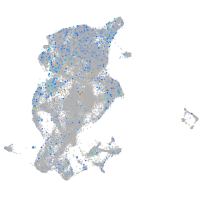
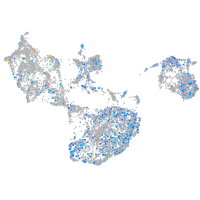
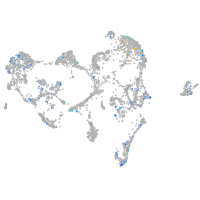
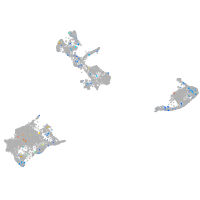
Gene expression UMAP
Display:
Expression
Stage
Other cell groups
all cells
blastomeres
PGCs
endoderm
axial mesoderm
muscle
mural cells /
non-skeletal muscle
mesenchyme
hematopoietic /
vasculature
pronephros
neural
spinal cord / glia
eye
taste / olfactory
otic / lateral line
epidermis
periderm
fin
ionocytes / mucous
pigment cells
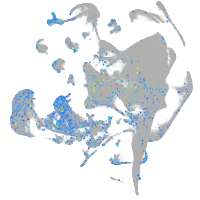
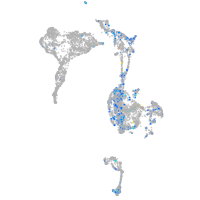
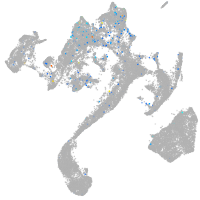
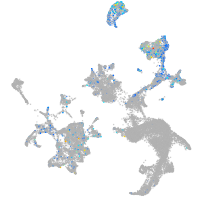
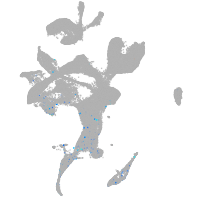
Expression by stage/cluster
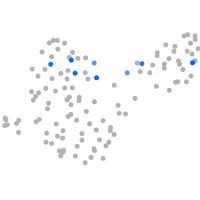
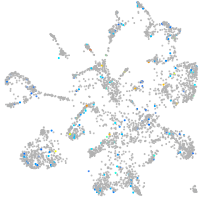
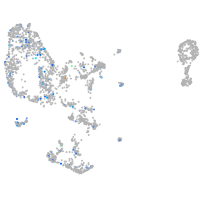
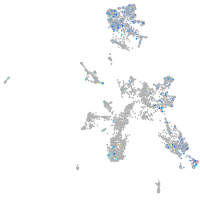
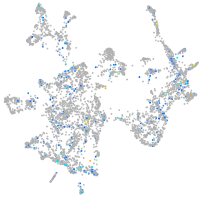
Correlated gene expression
Positive correlation
Negative correlation
Gene
r
Gene
r
BX276107.1
0.225
rpl10
-0.043
nt5c1ab
0.209
rps20
-0.041
nfatc2b
0.174
rps27a
-0.034
si:ch211-74m13.1
0.164
tardbpl
-0.032
si:dkeyp-87d8.8
0.163
nip7
-0.031
FQ311924.1
0.158
rps15a
-0.029
BX324181.1
0.157
ybx1
-0.029
BX957336.2
0.156
ube2na
-0.029
itpk1a
0.152
nucks1a
-0.028
myct1a
0.147
eif3g
-0.028
dapp1
0.147
ddx61
-0.027
gata4
0.146
rplp1
-0.027
prrt1
0.146
ctnnb1
-0.027
mrap2a
0.146
snrpg
-0.027
CR848746.1
0.130
si:dkey-250d21.1
-0.026
prkcab
0.125
znf207a
-0.025
cryba2a
0.123
twsg1b
-0.025
erbb4a
0.119
rps19
-0.025
LOC101886779
0.114
btg1
-0.024
cx32.2
0.109
psmb7
-0.024
BX936303.2
0.108
psmc3
-0.024
lrrtm4l1
0.107
rbm6
-0.024
znf1110
0.106
dynll1
-0.024
dlx4a
0.104
nifk
-0.024
CR387984.1
0.102
rpl4
-0.024
si:busm1-57f23.1
0.102
rad51
-0.024
lrguk
0.101
tmcc3
-0.024
si:dkey-90l8.3
0.099
rpl17
-0.023
tmem154
0.099
h3f3c
-0.023
pglyrp6
0.097
atp1b1a
-0.023
CABZ01102109.1
0.096
CABZ01080702.1
-0.023
CABZ01074085.1
0.095
eif4g1a
-0.023
LOC110439758
0.094
apoc1
-0.023
si:dkey-122c11.8
0.094
alcamb
-0.023
XLOC-015238
0.094
fkbp1aa
-0.023