Daniocell
ipp (glial cells / spinal cord)
intracisternal A particle-promoted polypeptide
ZFIN
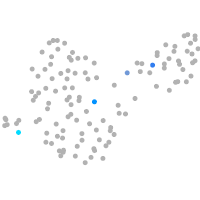
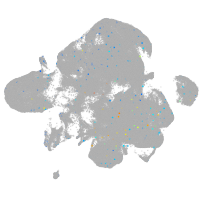
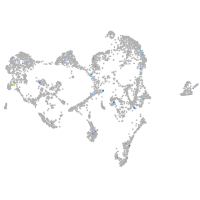
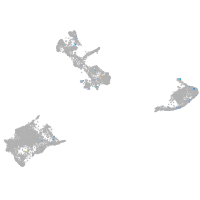
Gene expression UMAP
Display:
Expression
Stage
Other cell groups
all cells
blastomeres
PGCs
endoderm
axial mesoderm
muscle
mural cells /
non-skeletal muscle
mesenchyme
hematopoietic /
vasculature
pronephros
neural
spinal cord / glia
eye
taste / olfactory
otic / lateral line
epidermis
periderm
fin
ionocytes / mucous
pigment cells
Expression by stage/cluster
Correlated gene expression
Positive correlation
Negative correlation
Gene
r
Gene
r
kcnj2b
0.165
rps14
-0.027
guca1g
0.139
si:dkey-151g10.6
-0.026
CR391977.1
0.090
rplp1
-0.026
CU896691.2
0.088
stmn1a
-0.026
LOC101884122
0.088
hmgb2a
-0.025
LOC101887068
0.082
XLOC-003692
-0.025
LOC110438056
0.082
rps27a
-0.025
XLOC-005580
0.078
rpl11
-0.024
LOC103909765
0.072
hmgb2b
-0.024
CR854965.2
0.071
rpl39
-0.024
CT573186.2
0.069
rps17
-0.023
LOC108190565
0.069
rps20
-0.022
il2rb
0.068
rps19
-0.022
LOC108190067
0.066
XLOC-003690
-0.022
CABZ01090544.1
0.064
sox3
-0.021
tnnt2b
0.061
lrrn1
-0.021
LOC108182671
0.058
rps15a
-0.021
ANO2 (1 of many)
0.055
her15.1
-0.021
NC-002333.24
0.055
rps24
-0.020
LOC103911830
0.055
abhd6a
-0.020
LOC103911517
0.054
rpl37
-0.020
CR361564.1
0.052
rpl35
-0.020
LOC103909899
0.052
si:ch73-281n10.2
-0.020
ccl39.2
0.051
ccnd1
-0.020
grk5
0.050
rpl5b
-0.020
hspb3
0.050
eef1b2
-0.019
cx52.9
0.050
XLOC-003689
-0.019
LOC101884197
0.050
cx43.4
-0.019
CABZ01084603.1
0.049
fkbp3
-0.019
kcnh2a
0.049
rrm1
-0.019
ora5
0.048
dut
-0.019
si:ch211-117c19.1
0.048
tspan7
-0.019
CU682811.1
0.048
snrpb
-0.018
si:ch211-202n12.2
0.048
msi1
-0.018
ltk
0.047
msna
-0.018