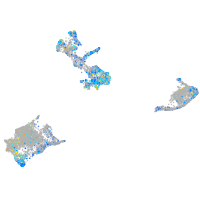
inositol hexakisphosphate kinase 2a
ZFIN 
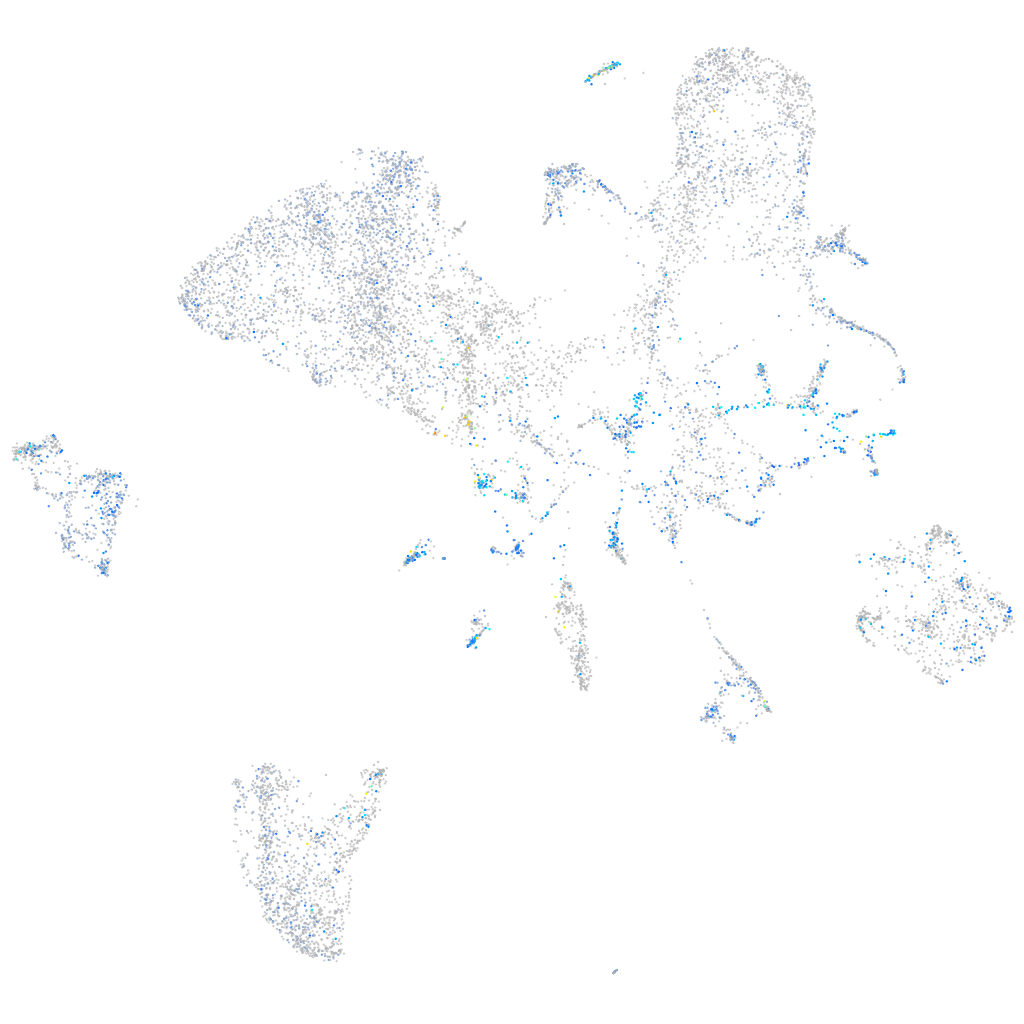
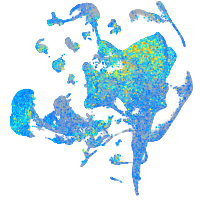
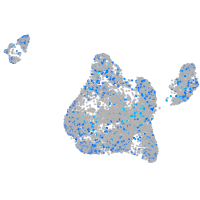
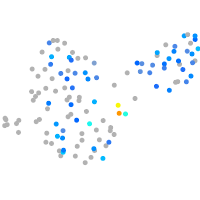
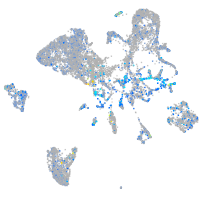
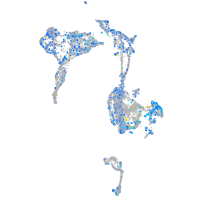
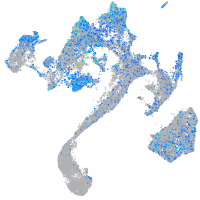
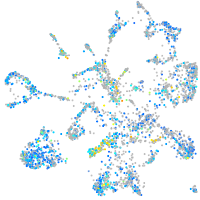
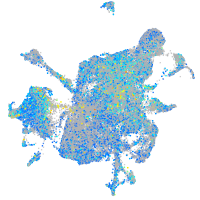
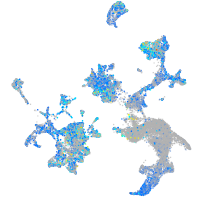
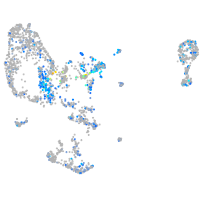
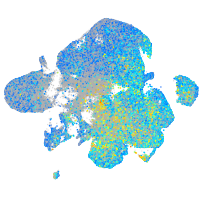
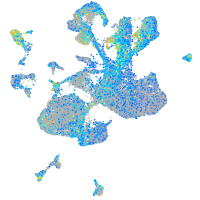
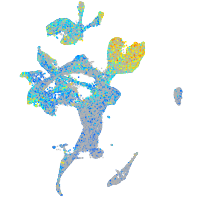
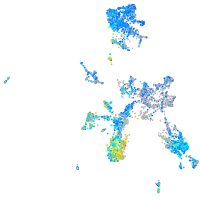
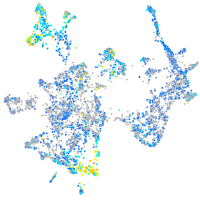
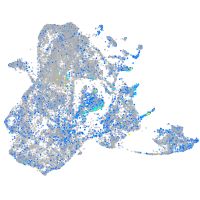
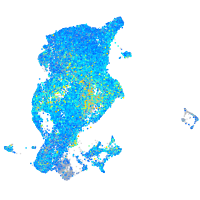
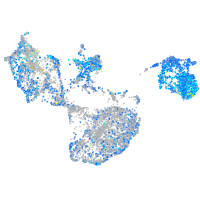
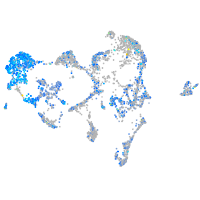
Expression by stage/cluster


Correlated gene expression


| Positive correlation | Negative correlation | ||
| Gene | r | Gene | r |
| scg3 | 0.260 | gamt | -0.195 |
| insm1a | 0.255 | gapdh | -0.183 |
| insm1b | 0.250 | gatm | -0.179 |
| neurod1 | 0.250 | fbp1b | -0.175 |
| myt1b | 0.243 | aldob | -0.165 |
| dlb | 0.240 | apoc2 | -0.163 |
| si:ch1073-429i10.3.1 | 0.232 | ahcy | -0.162 |
| ptmaa | 0.231 | gstt1a | -0.154 |
| rnasekb | 0.230 | gpx4a | -0.152 |
| oaz1b | 0.228 | apoa4b.1 | -0.152 |
| anxa4 | 0.228 | afp4 | -0.148 |
| id4 | 0.227 | scp2a | -0.147 |
| CR383676.1 | 0.227 | glud1b | -0.146 |
| elovl1a | 0.226 | mat1a | -0.146 |
| gnb1a | 0.223 | bhmt | -0.143 |
| mir375-2 | 0.222 | nupr1b | -0.140 |
| gapdhs | 0.221 | si:dkey-16p21.8 | -0.139 |
| mir7a-1 | 0.220 | gstr | -0.139 |
| calm1a | 0.220 | apoa1b | -0.137 |
| h3f3c | 0.219 | sult2st2 | -0.137 |
| ier2b | 0.215 | cdo1 | -0.136 |
| jpt1b | 0.214 | hspe1 | -0.136 |
| tox | 0.214 | suclg1 | -0.136 |
| calm1b | 0.211 | pla2g12b | -0.135 |
| lysmd2 | 0.208 | gcshb | -0.135 |
| tmem59 | 0.202 | rdh1 | -0.133 |
| syt1a | 0.200 | msrb2 | -0.132 |
| ubc | 0.200 | hspd1 | -0.130 |
| fev | 0.199 | suclg2 | -0.128 |
| si:dkey-42i9.4 | 0.199 | aqp12 | -0.126 |
| dusp2 | 0.199 | eno3 | -0.125 |
| h2afx1 | 0.198 | aldh6a1 | -0.124 |
| si:ch211-196l7.4 | 0.198 | cx32.3 | -0.124 |
| tmsb | 0.197 | apobb.1 | -0.124 |
| hmgb1a | 0.197 | dap | -0.123 |


