Daniocell
ints1 (pronephros)
integrator complex subunit 1
ZFIN
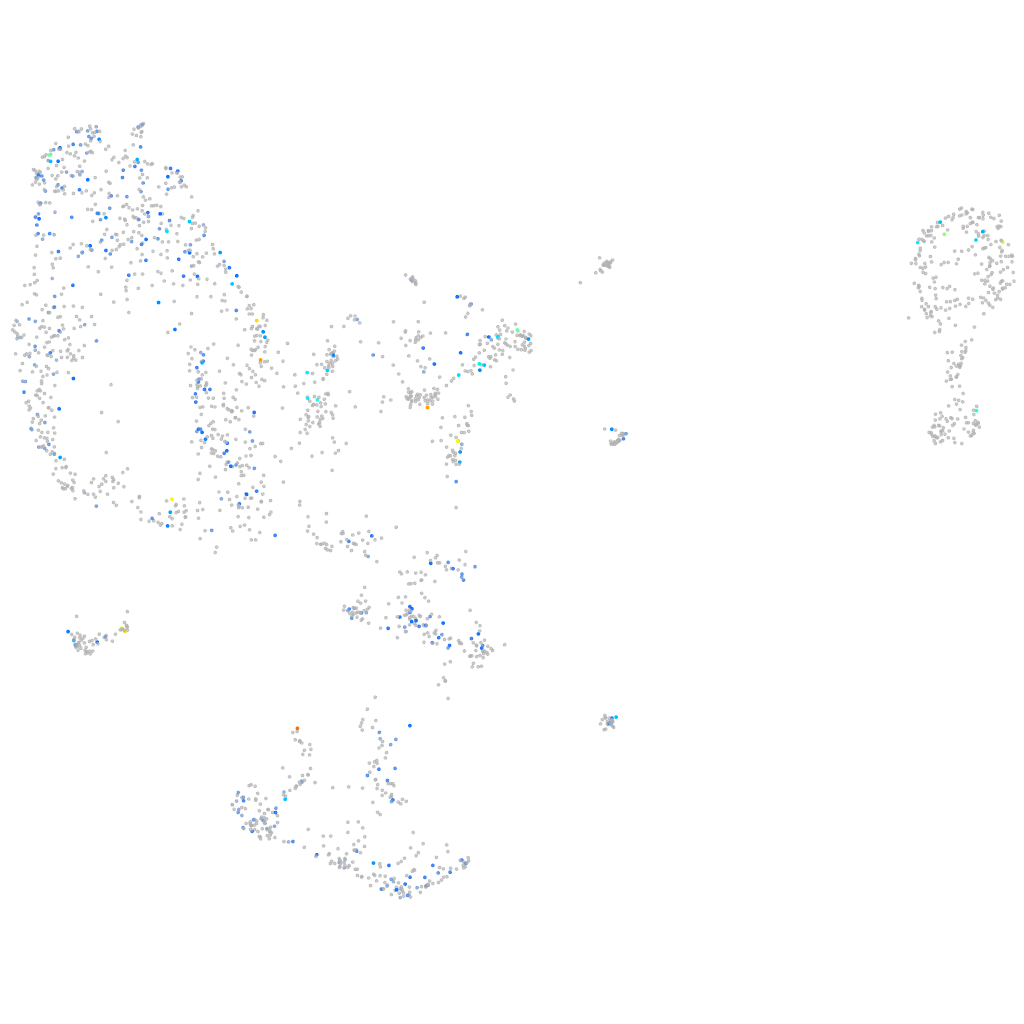
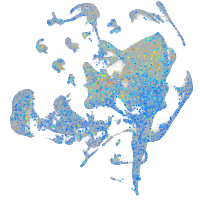
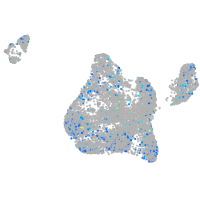
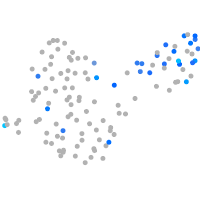
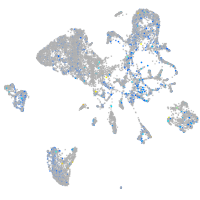
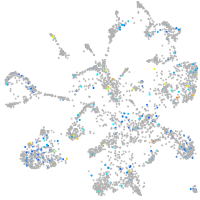
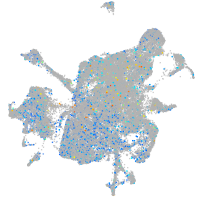
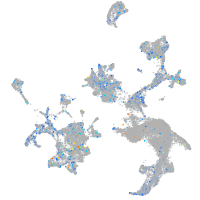
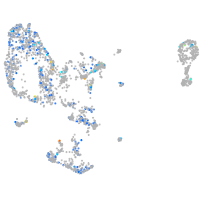
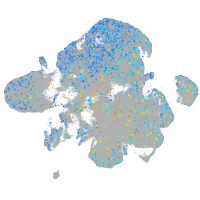
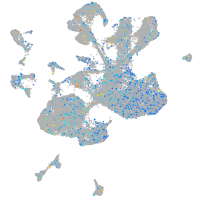
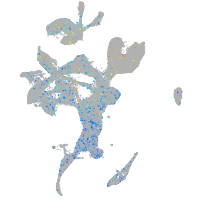
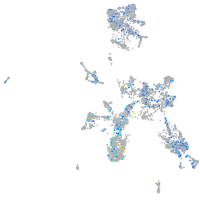
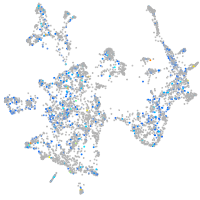
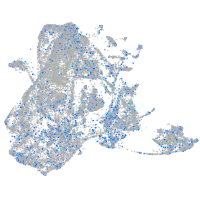
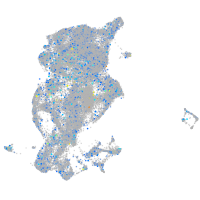
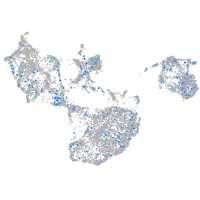
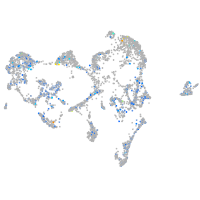
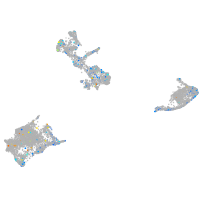
Gene expression UMAP
Display:
Expression
Stage
Other cell groups
all cells
blastomeres
PGCs
endoderm
axial mesoderm
muscle
mural cells /
non-skeletal muscle
mesenchyme
hematopoietic /
vasculature
pronephros
neural
spinal cord / glia
eye
taste / olfactory
otic / lateral line
epidermis
periderm
fin
ionocytes / mucous
pigment cells
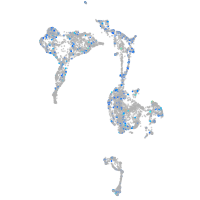
Expression by stage/cluster
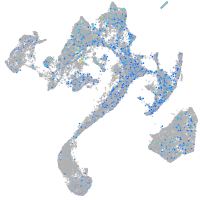
Correlated gene expression
Positive correlation
Negative correlation
Gene
r
Gene
r
crybb3
0.213
ddx24
-0.083
mir199-2
0.208
eif3g
-0.079
camta1
0.205
wu:fb97g03
-0.078
BX649516.2
0.187
eef1a1l1
-0.077
pimr184
0.167
zgc:110425
-0.076
zgc:194252
0.167
mybbp1a
-0.076
LOC101886896
0.166
mphosph10
-0.075
si:cabz01069015.1
0.166
cd2bp2
-0.075
foxo1b
0.166
rrp1
-0.074
CABZ01088049.1
0.161
ttf1
-0.074
LOC103909515
0.161
hmgb2a
-0.073
pappaa
0.157
rpl4
-0.073
si:ch211-103n10.5
0.156
rps12
-0.072
sox12
0.151
znfl2a
-0.072
LOC103910894
0.151
hmgn6
-0.071
XLOC-023519
0.151
wnt5b
-0.070
gpr185b
0.150
rsl1d1
-0.070
BX569801.1
0.148
nasp
-0.068
si:dkey-106n21.1
0.147
dkc1
-0.068
nkx2.2b
0.146
seta
-0.068
si:ch1073-159d7.6
0.144
ISCU
-0.068
LOC100001713
0.144
bms1
-0.067
LOC110440123
0.143
si:ch73-281n10.2
-0.067
npffr2b
0.143
npm1a
-0.066
kcnq3
0.141
pes
-0.065
znfl1l
0.139
wdr43
-0.065
nlrc5
0.138
serpinh1b
-0.065
pex1
0.138
mnx1
-0.065
arl15b
0.136
nradd
-0.065
CR848833.1
0.136
smarcb1a
-0.064
tmprss3a
0.135
smo
-0.064
si:dkeyp-110a12.4
0.134
apoeb
-0.064
slx1b
0.134
nop58
-0.064
elmo2
0.133
si:ch73-299h12.3
-0.064
LOC108182865
0.132
snrnp70
-0.063