Daniocell
inpp5f (taste / olfactory)
inositol polyphosphate-5-phosphatase F
ZFIN
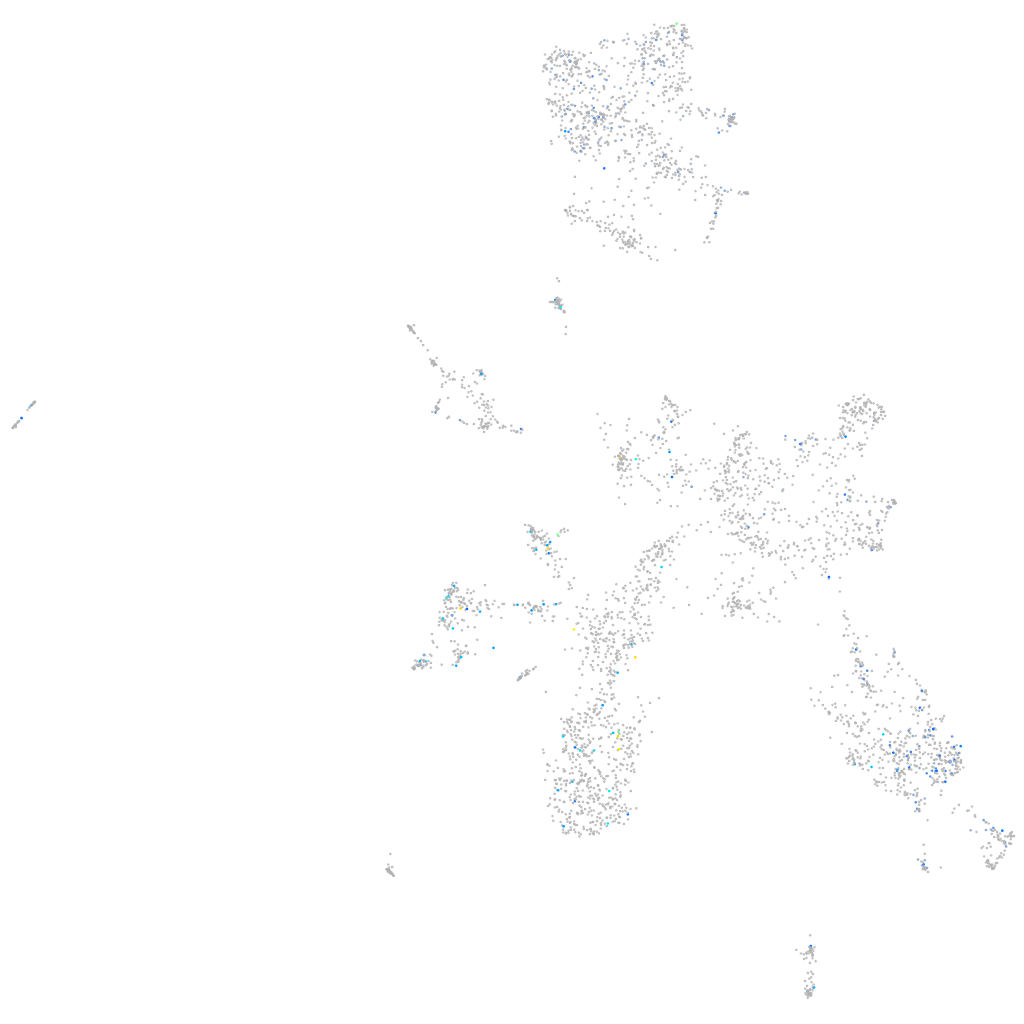
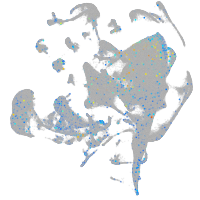
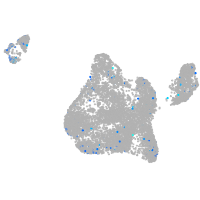
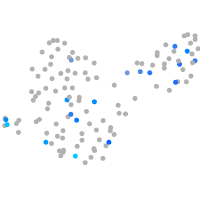
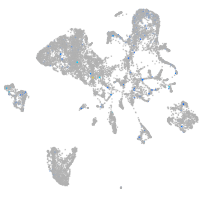
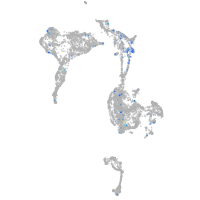
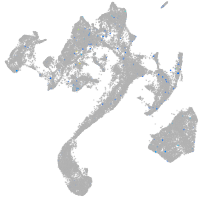
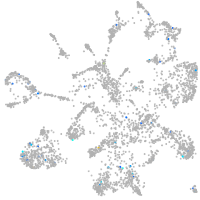
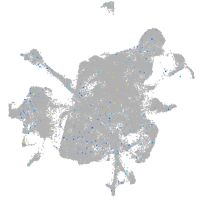
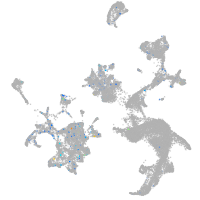
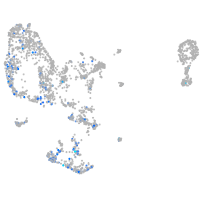
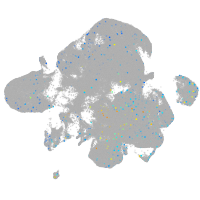
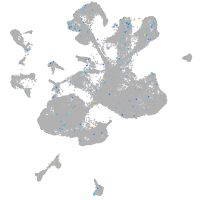
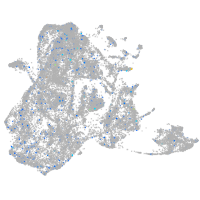
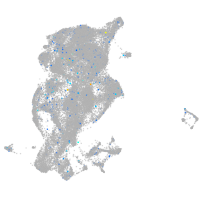
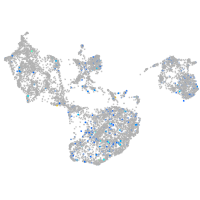
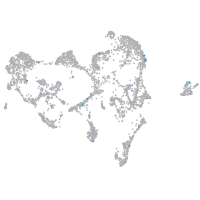
Gene expression UMAP
Display:
Expression
Stage
Other cell groups
all cells
blastomeres
PGCs
endoderm
axial mesoderm
muscle
mural cells /
non-skeletal muscle
mesenchyme
hematopoietic /
vasculature
pronephros
neural
spinal cord / glia
eye
taste / olfactory
otic / lateral line
epidermis
periderm
fin
ionocytes / mucous
pigment cells
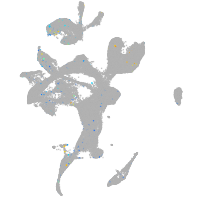
Expression by stage/cluster
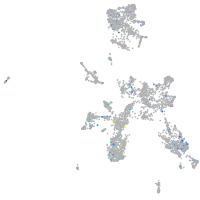
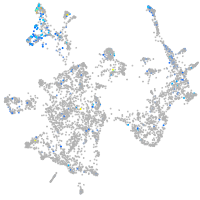
Correlated gene expression
Positive correlation
Negative correlation
Gene
r
Gene
r
LOC110439573
0.217
rps23
-0.137
LOC101886926
0.160
rpl13
-0.129
CR450720.1
0.160
rpl23
-0.119
grk1a
0.153
rplp1
-0.116
LOC110437938
0.151
rps24
-0.115
CR936974.1
0.149
rpl10
-0.113
camk1b
0.148
rps14
-0.113
si:ch211-130m23.3
0.148
rpl11
-0.107
kcns3a
0.143
rpl14
-0.104
si:dkey-202e22.2
0.141
faua
-0.103
znf1128
0.140
rpl21
-0.103
BX294160.1
0.136
rps27a
-0.102
LOC110439893
0.135
rpl28
-0.102
XLOC-028466
0.134
rpl30
-0.101
si:ch1073-90m23.1
0.134
rps26
-0.101
si:dkey-37o8.1
0.133
rpl12
-0.099
epn3b
0.133
rps27.1
-0.098
si:dkeyp-77h1.4
0.130
rpl13a
-0.098
XLOC-041499
0.129
si:dkey-151g10.6
-0.095
zgc:85722
0.123
rpl35a
-0.095
CABZ01079241.1
0.122
rps5
-0.095
LOC110437769
0.121
rps19
-0.095
fstl5
0.121
rpsa
-0.094
LOC110439590
0.120
rpl7a
-0.094
or123-1
0.118
rpl9
-0.094
LOC101882691
0.118
eef1a1l1
-0.094
pfkmb
0.117
rps15a
-0.094
gabrg1
0.117
rpl26
-0.092
msi2b
0.116
rps3a
-0.091
LOC101886386
0.116
rpl10a
-0.091
inpp4ab
0.116
rps20
-0.091
iqcg
0.116
rpl8
-0.090
LOC101885083
0.116
rps21
-0.089
CABZ01060891.1
0.115
rps16
-0.088
map1b
0.115
rps2
-0.088