Daniocell
impa2 (hematopoietic / vasculature)
inositol(myo)-1(or 4)-monophosphatase 2
ZFIN
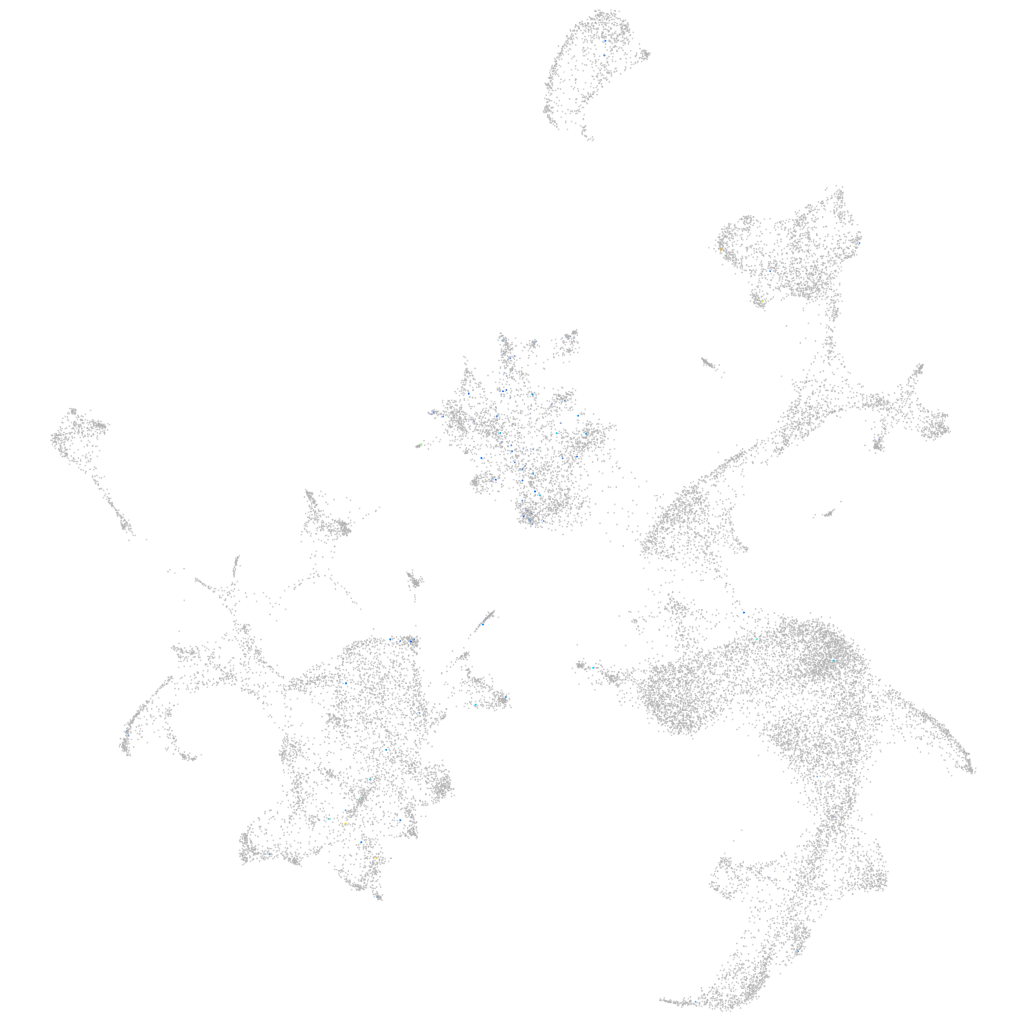
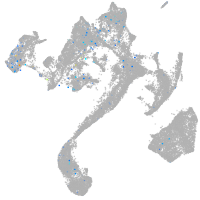
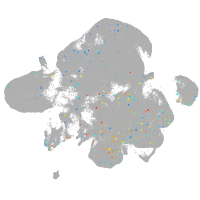
Gene expression UMAP
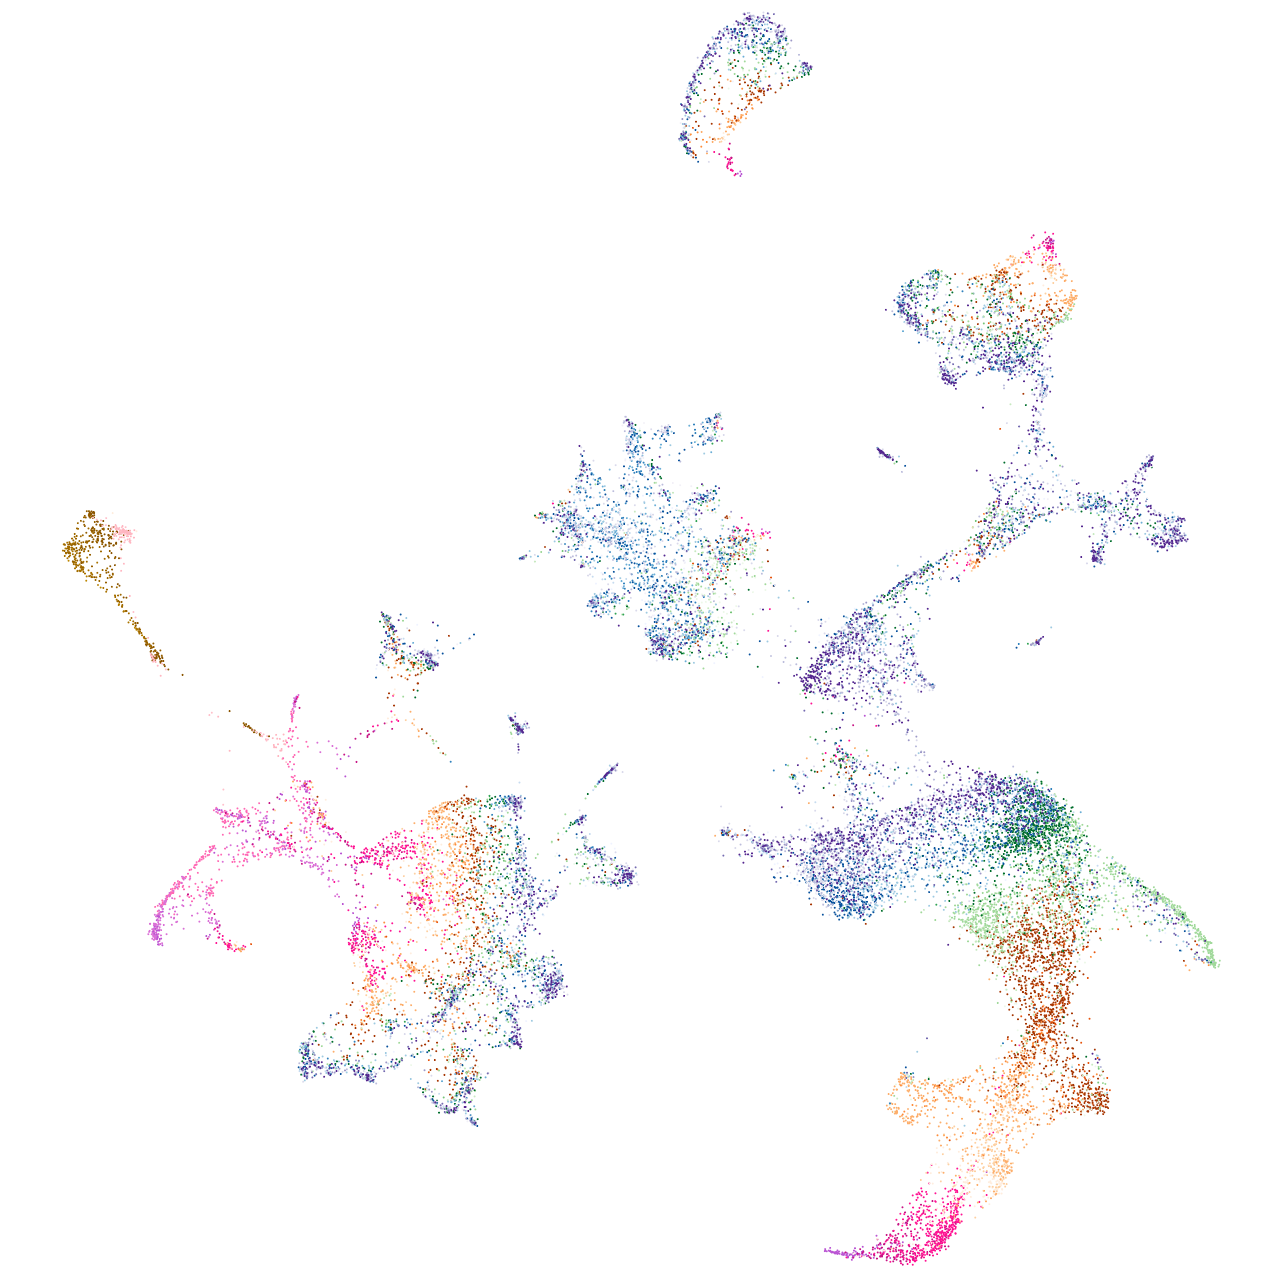
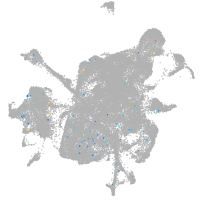
Display:
Expression
Stage
Other cell groups
all cells
blastomeres
PGCs
endoderm
axial mesoderm
muscle
mural cells /
non-skeletal muscle
mesenchyme
hematopoietic /
vasculature
pronephros
neural
spinal cord / glia
eye
taste / olfactory
otic / lateral line
epidermis
periderm
fin
ionocytes / mucous
pigment cells
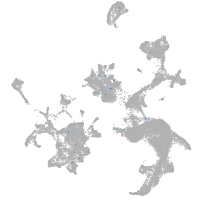
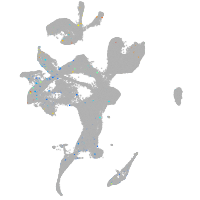
Expression by stage/cluster
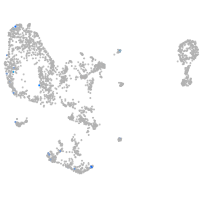
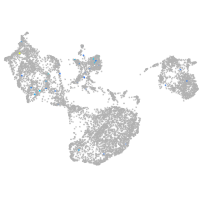
Correlated gene expression
Positive correlation
Negative correlation
Gene
r
Gene
r
mir183
0.292
hbbe3
-0.020
gprc6a
0.206
hdr
-0.018
ANPEP
0.199
znfl2a
-0.017
best1
0.195
vdac2
-0.016
galr1a
0.179
zgc:56095
-0.016
cbln11
0.152
slc4a1a
-0.016
adamts6
0.147
cbr1l
-0.016
CABZ01078080.1
0.138
hemgn
-0.015
LOC103908820
0.136
nmt1b
-0.015
CABZ01068356.1
0.130
urod
-0.015
si:dkey-202c14.3
0.128
rac2
-0.015
il17ra1b
0.126
tspo
-0.015
si:ch73-7i4.1
0.124
si:dkey-93h22.7
-0.015
LOC110437922
0.121
rhd
-0.014
LOC103910804
0.118
sptb
-0.014
XLOC-036507
0.113
dnase1l4.2
-0.014
si:rp71-1f1.5
0.113
f13a1b
-0.014
arhgap44
0.105
hmbsb
-0.014
CABZ01088308.1
0.102
cxcr3.2
-0.014
si:ch211-222n4.2
0.101
grap2b
-0.013
si:dkey-59l11.10
0.100
gp1bb
-0.013
LOC110439394
0.100
guk1a
-0.013
usp54b
0.095
slc10a4
-0.013
XLOC-029890
0.094
rabgap1l
-0.013
usp2b
0.094
ppox
-0.013
ssx2ipb
0.092
lrrc15
-0.013
slc2a9l2
0.091
epb41b
-0.013
LOC101882575
0.090
fth1a
-0.012
si:ch211-59d8.2
0.089
nt5c2l1
-0.012
LOC101885868
0.088
sb:cb81
-0.012
dlgap1b
0.087
prdx2
-0.012
zgc:152753
0.086
ucp3
-0.012
dok7
0.083
hebp2
-0.012
FP236454.1
0.082
si:ch73-248e21.7
-0.012
si:dkey-40c23.2
0.081
lpar5a
-0.012