Daniocell
immp1l (periderm)
inner mitochondrial membrane peptidase subunit 1
ZFIN
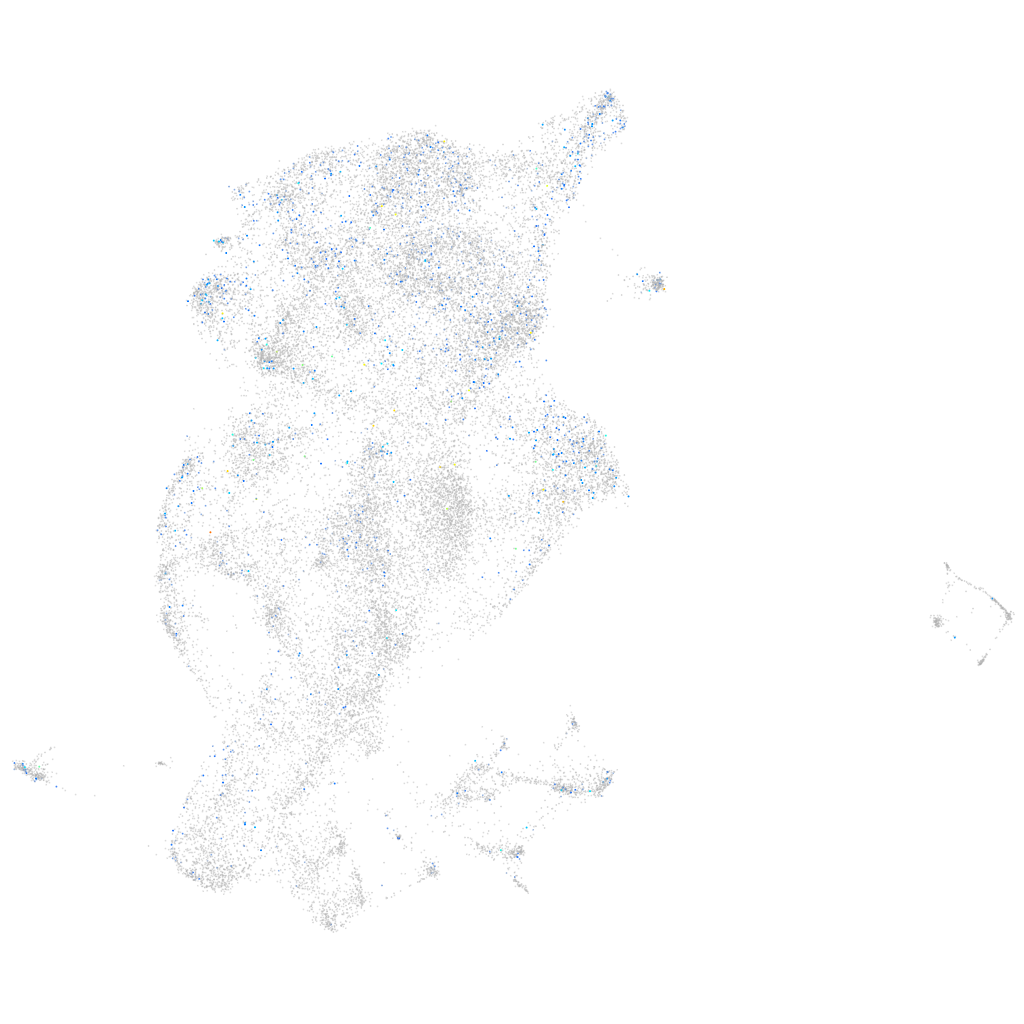
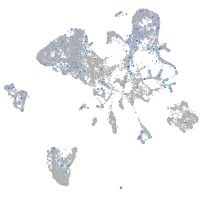
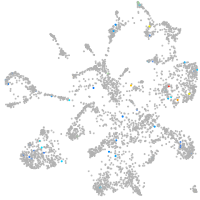
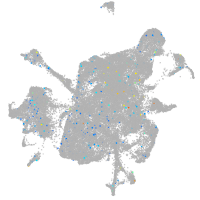
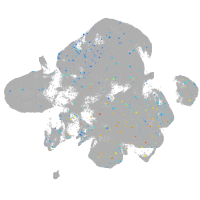
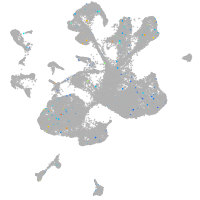
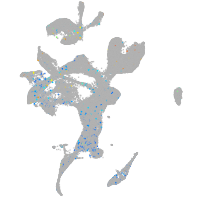
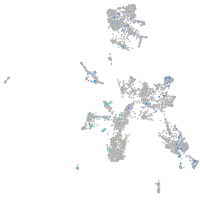
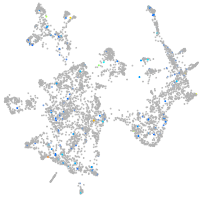
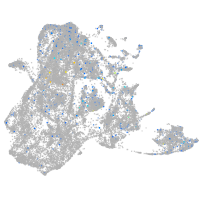
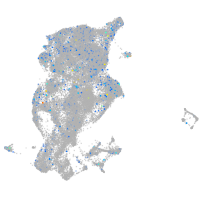
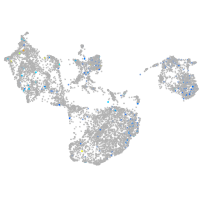
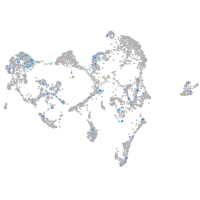
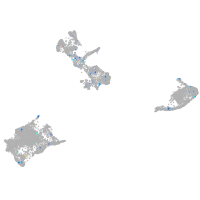
Gene expression UMAP
Display:
Expression
Stage
Other cell groups
all cells
blastomeres
PGCs
endoderm
axial mesoderm
muscle
mural cells /
non-skeletal muscle
mesenchyme
hematopoietic /
vasculature
pronephros
neural
spinal cord / glia
eye
taste / olfactory
otic / lateral line
epidermis
periderm
fin
ionocytes / mucous
pigment cells
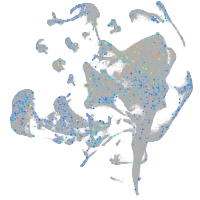
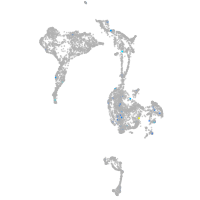
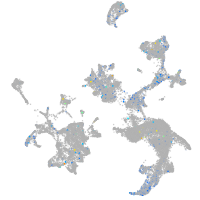
Expression by stage/cluster
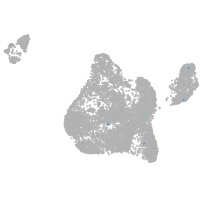
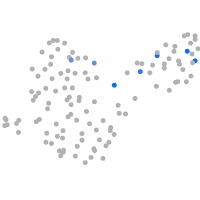
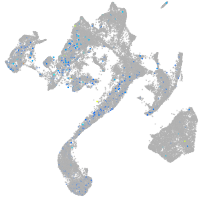
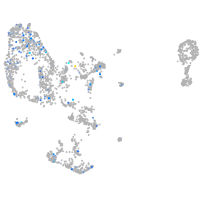
Correlated gene expression
Positive correlation
Negative correlation
Gene
r
Gene
r
zgc:195356
0.099
krt92
-0.056
si:ch211-207n23.2
0.082
tmsb4x
-0.054
nme2b.1
0.078
ywhaz
-0.053
si:dkey-247k7.2
0.076
osgn1
-0.052
si:dkeyp-51b9.3
0.075
nos1
-0.049
eef1da
0.074
alox12
-0.045
eef1b2
0.074
si:ch73-1a9.3
-0.045
sod1
0.073
pabpc1b
-0.043
HTRA2 (1 of many).1
0.071
CABZ01072614.1
-0.042
hspa8
0.068
adh8b
-0.041
scel
0.068
si:ch73-281n10.2
-0.040
si:dkey-72l14.3
0.067
si:ch211-202h22.8
-0.039
tlcd1
0.066
hmga1a
-0.038
b2ml
0.065
tgm1l4
-0.038
atp5mc3b
0.065
zgc:174938
-0.038
si:dkey-33c14.3
0.064
CU459056.1
-0.037
cd63
0.064
gsnb
-0.036
glo1
0.064
evplb
-0.036
pycard
0.063
gale
-0.036
BX546459.1
0.063
hbbe3
-0.036
rps5
0.063
krt18a.1
-0.035
ppdpfb
0.062
XLOC-032526
-0.034
ran
0.062
NC-002333.4
-0.034
rpl28
0.061
trim71
-0.034
wu:fa03e10
0.061
arpc1a
-0.034
rpl26
0.061
cnih4
-0.033
eef1g
0.060
naalad2
-0.033
rpl22
0.060
mboat1
-0.033
dhrs13a.2
0.060
si:ch211-264e16.1
-0.033
CABZ01113981.1
0.060
aep1
-0.033
rps27.1
0.059
capn9
-0.033
eevs
0.059
NC-002333.17
-0.033
eef2b
0.059
scinla
-0.032
ybx1
0.059
ponzr5
-0.032
rplp0
0.058
myh9a
-0.032