Daniocell
igfbp5a (periderm)
insulin-like growth factor binding protein 5a
ZFIN
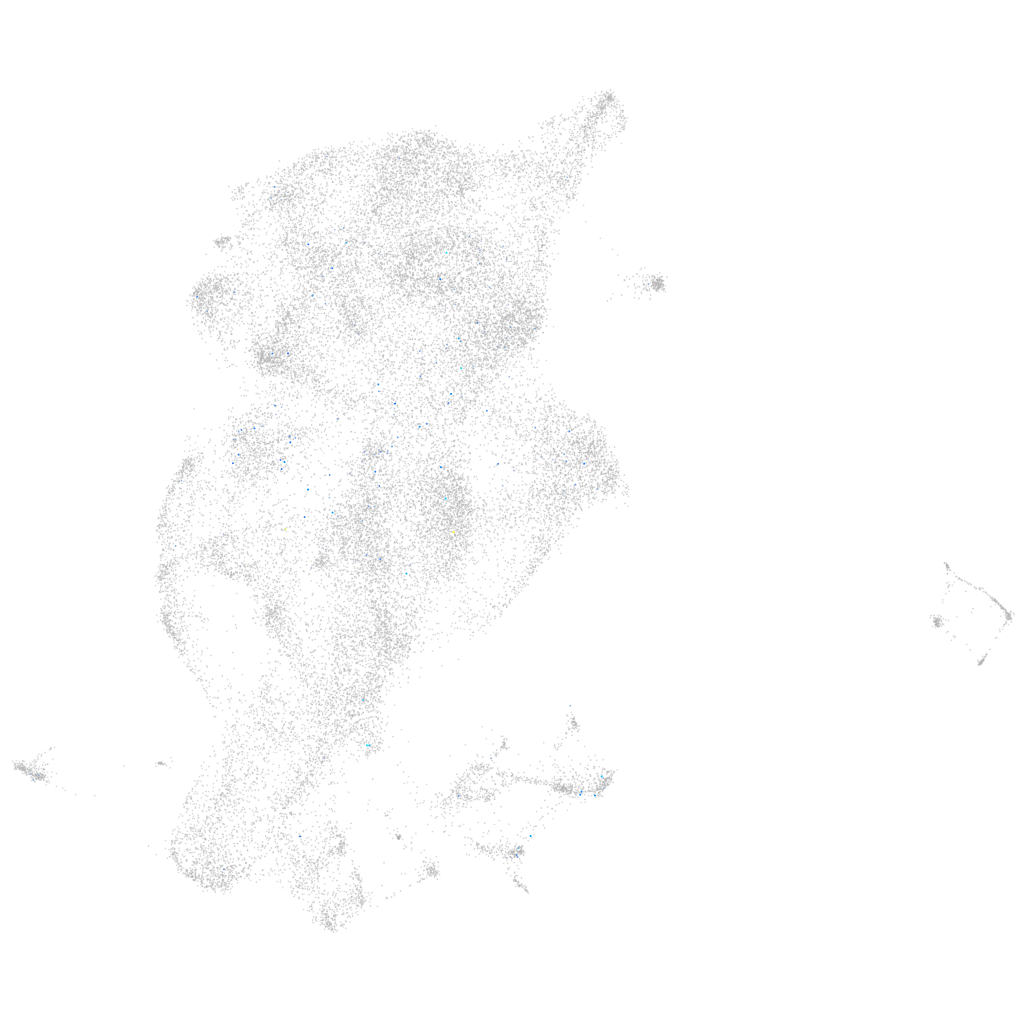
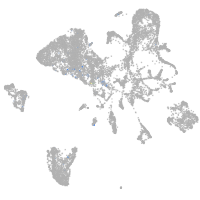
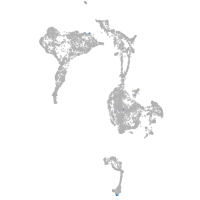
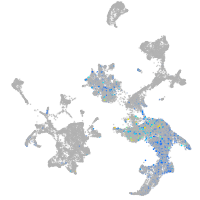
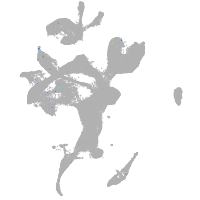
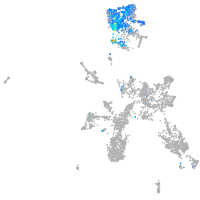
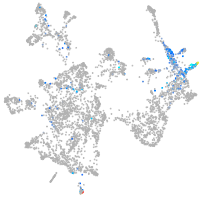
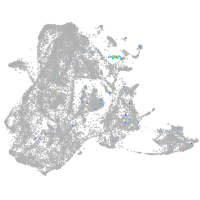
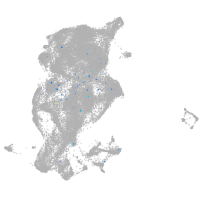
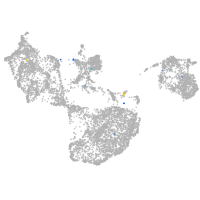
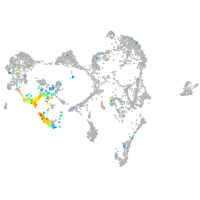
Gene expression UMAP
Display:
Expression
Stage
Other cell groups
all cells
blastomeres
PGCs
endoderm
axial mesoderm
muscle
mural cells /
non-skeletal muscle
mesenchyme
hematopoietic /
vasculature
pronephros
neural
spinal cord / glia
eye
taste / olfactory
otic / lateral line
epidermis
periderm
fin
ionocytes / mucous
pigment cells
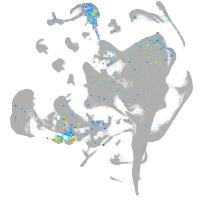
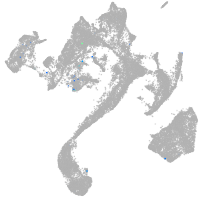
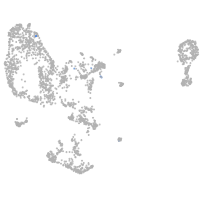
Expression by stage/cluster
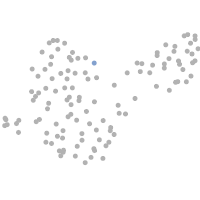
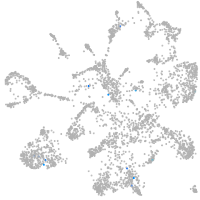
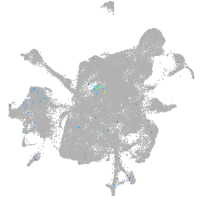
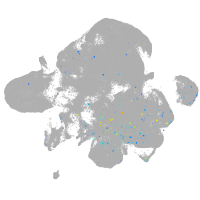
Correlated gene expression
Positive correlation
Negative correlation
Gene
r
Gene
r
BX664625.3
0.257
anxa1a
-0.021
CR559945.1
0.132
hmga1a
-0.019
pde4a
0.132
tmsb1
-0.019
LOC103910049
0.129
s100w
-0.019
BX088718.1
0.118
ssr4
-0.019
CABZ01087502.1
0.117
glulb
-0.018
LOC108182124
0.115
cdc42l
-0.018
CU019647.1
0.110
gale
-0.018
si:dkey-225f23.5
0.107
dspa
-0.018
kcnj19a
0.106
krt92
-0.018
BX649490.4
0.106
atp1b1a
-0.017
CT009597.1
0.104
cenpx
-0.017
sema3h
0.102
ANXA1 (1 of many)
-0.016
XLOC-021406
0.098
si:ch211-157c3.4
-0.016
cpne9
0.092
si:ch211-284b7.3
-0.016
LOC103911288
0.091
rps28
-0.016
si:ch211-63p21.8
0.091
cfl1l
-0.016
LOC110439983
0.090
stx11b.2
-0.016
edaradd
0.088
si:ch211-202h22.8
-0.016
BX470116.1
0.088
agpat4
-0.016
txnipb
0.086
jdp2b
-0.016
CR848833.1
0.085
s100a10b
-0.016
LOC101882072
0.085
scinla
-0.016
LO018437.1
0.079
krt8
-0.016
si:ch73-182a11.2
0.078
bud31
-0.015
si:dkey-237g15.2
0.078
zgc:174935
-0.015
FP326652.1
0.077
rpl18
-0.015
slc51a
0.076
icn
-0.015
grid1b
0.076
coro2a
-0.015
CABZ01053748.1
0.075
mat2b
-0.015
TCERG1L
0.075
mif
-0.015
or128-2
0.075
cenpw
-0.015
LOC101882973
0.073
si:ch211-147d7.5
-0.015
cmlc1
0.073
polr2l
-0.015
l3mbtl1a
0.072
ddost
-0.015