Daniocell
ifih1 (mesenchyme)
interferon induced with helicase C domain 1
ZFIN
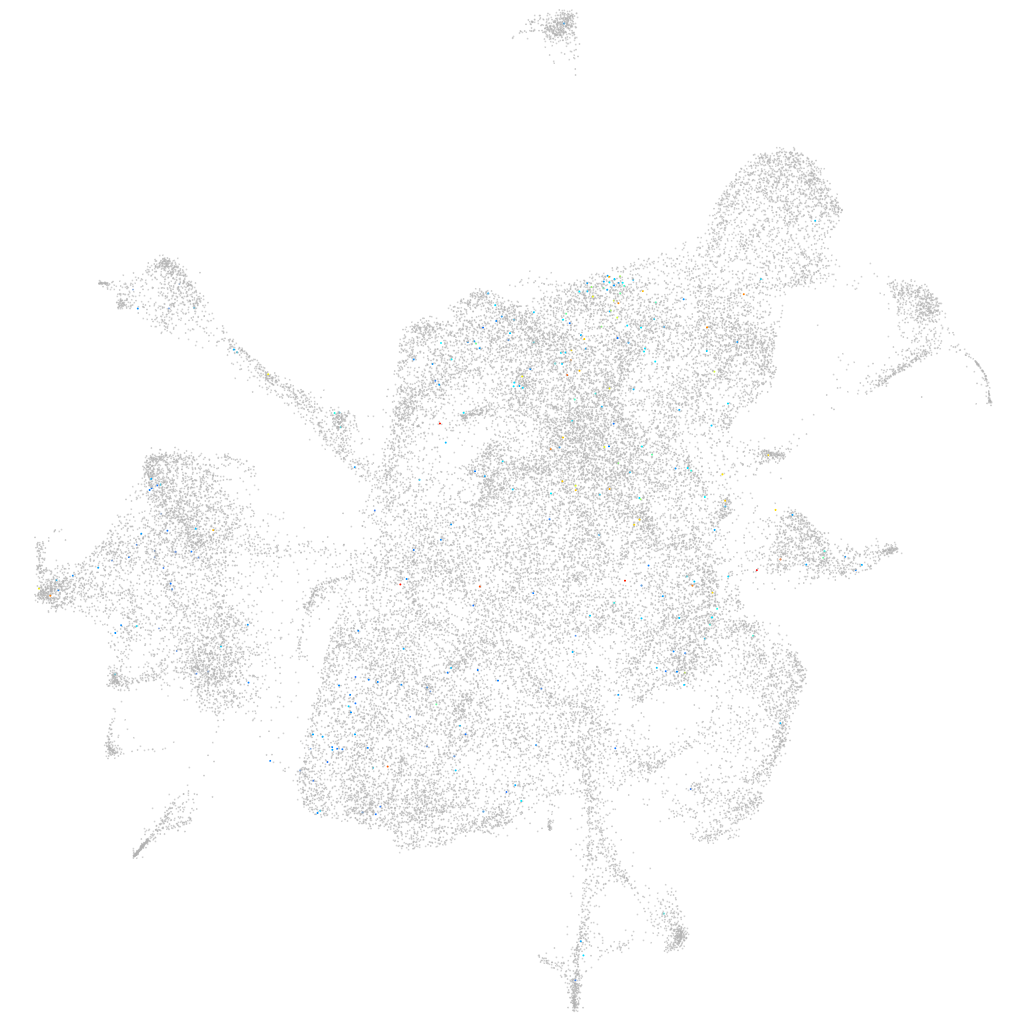
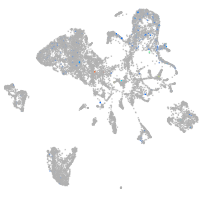
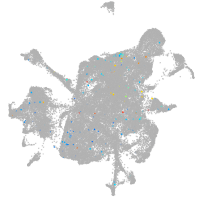
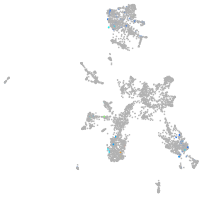
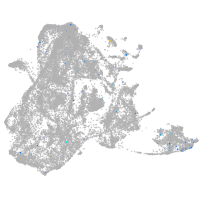
Gene expression UMAP
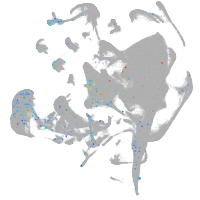
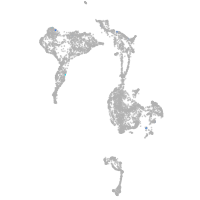
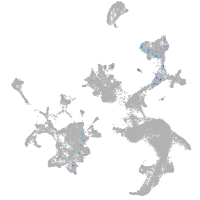
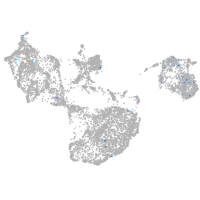
Display:
Expression
Stage
Other cell groups
all cells
blastomeres
PGCs
endoderm
axial mesoderm
muscle
mural cells /
non-skeletal muscle
mesenchyme
hematopoietic /
vasculature
pronephros
neural
spinal cord / glia
eye
taste / olfactory
otic / lateral line
epidermis
periderm
fin
ionocytes / mucous
pigment cells
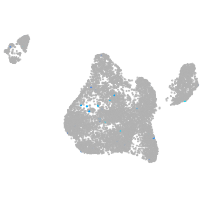
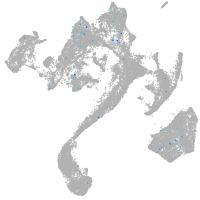
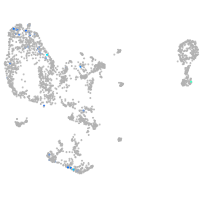
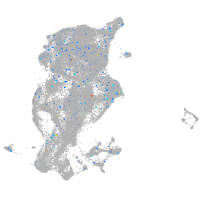
Expression by stage/cluster
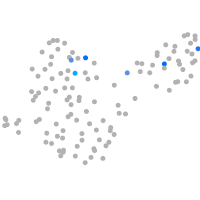
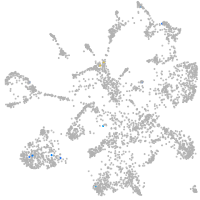
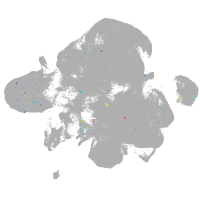
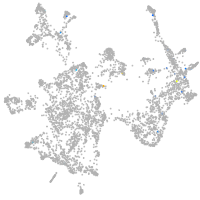
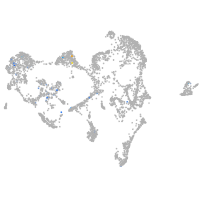
Correlated gene expression
Positive correlation
Negative correlation
Gene
r
Gene
r
si:ch73-338o16.4
0.094
aldoaa
-0.027
LOC570079
0.093
ptges3b
-0.026
BX323807.1
0.088
hmga1a
-0.025
LOC101883855
0.073
si:ch211-222l21.1
-0.025
CR847844.2
0.070
apex1
-0.025
ect2l
0.068
khdrbs1a
-0.023
opn8c
0.067
snrpd1
-0.022
ltb4r2a
0.065
h2afvb
-0.022
XLOC-007715
0.063
cox7b
-0.021
si:ch211-272h9.3
0.063
snrpg
-0.021
XLOC-044302
0.063
rbm4.3
-0.021
irbpl
0.060
alyref
-0.021
si:ch211-67f13.8
0.058
si:dkey-151g10.6
-0.021
grn2
0.057
cirbpa
-0.021
kcnh6b
0.055
snrpb
-0.020
BX927401.1
0.055
ilf3b
-0.020
XLOC-021259
0.055
lsm7
-0.020
CT033790.1
0.054
cirbpb
-0.020
or125-2
0.053
zgc:56493
-0.019
LO018493.1
0.053
marcksb
-0.019
LOC108182577
0.050
cyc1
-0.019
XLOC-023380
0.050
csde1
-0.019
CT573793.2
0.050
srsf11
-0.019
CR589947.2
0.050
pabpc1a
-0.019
adamtsl2
0.050
erh
-0.018
hyal4
0.049
coa3a
-0.018
CABZ01002809.1
0.049
sub1a
-0.018
BX908388.1
0.047
rps27.1
-0.018
spon2b
0.047
tomm20a
-0.018
LOC101882330
0.047
sf3b5
-0.018
acot19
0.046
sumo3b
-0.018
CR848025.1
0.045
tma7
-0.018
BX957345.1
0.045
rrs1
-0.018
XLOC-036690
0.044
rps29
-0.017
ctgfb
0.044
kars
-0.017