Daniocell
hsdl1 (endoderm)
hydroxysteroid dehydrogenase like 1
ZFIN
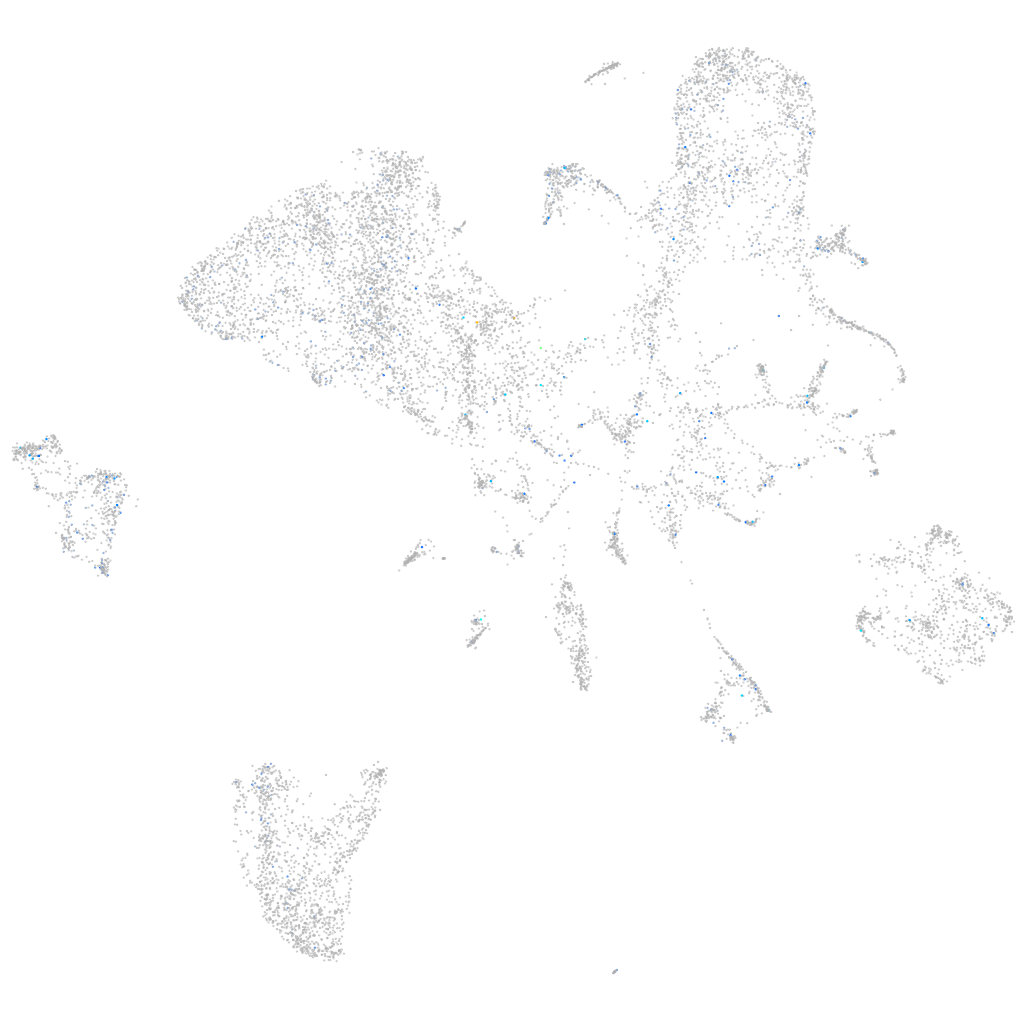
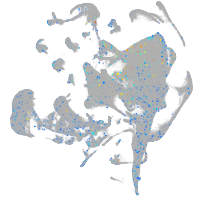
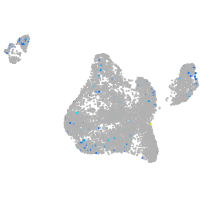
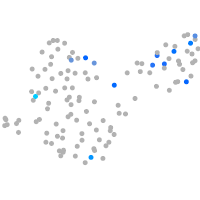
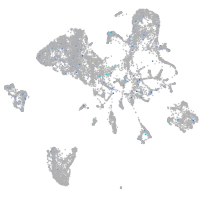
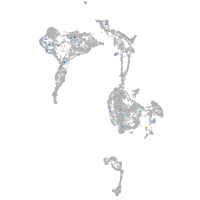
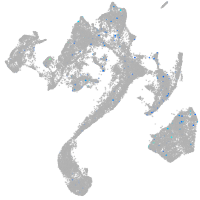
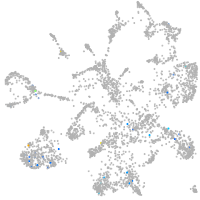
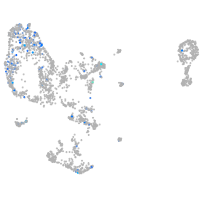
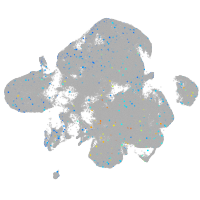
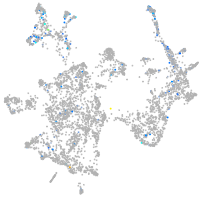
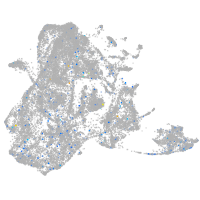
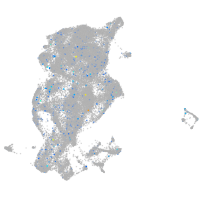
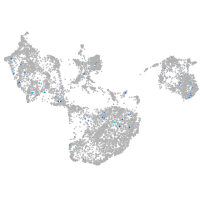
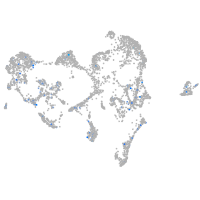
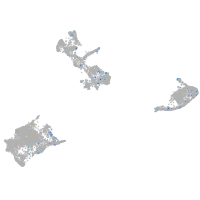
Gene expression UMAP
Display:
Expression
Stage
Other cell groups
all cells
blastomeres
PGCs
endoderm
axial mesoderm
muscle
mural cells /
non-skeletal muscle
mesenchyme
hematopoietic /
vasculature
pronephros
neural
spinal cord / glia
eye
taste / olfactory
otic / lateral line
epidermis
periderm
fin
ionocytes / mucous
pigment cells
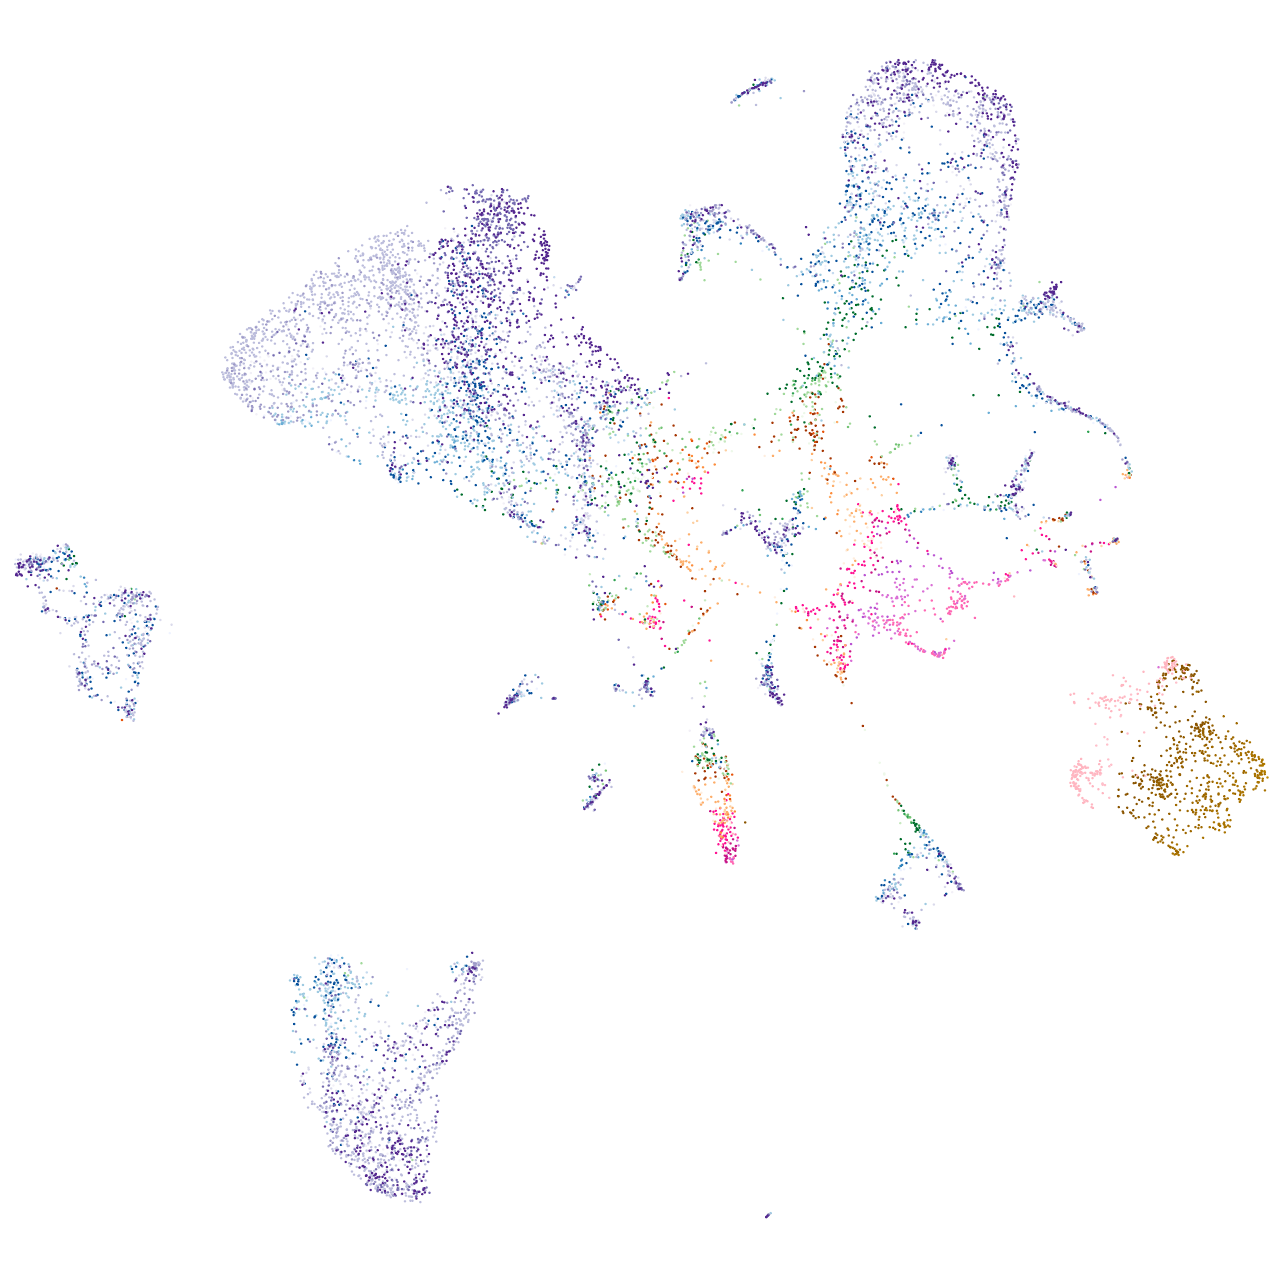
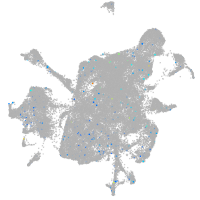
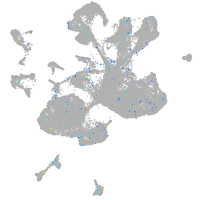
Expression by stage/cluster
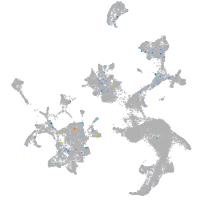
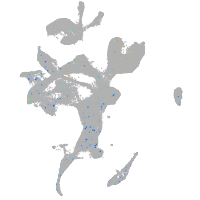
Correlated gene expression
Positive correlation
Negative correlation
Gene
r
Gene
r
LOC792894
0.194
gatm
-0.044
zgc:172122
0.157
amy2a
-0.042
CABZ01089081.1
0.134
ela2
-0.042
BX088603.1
0.127
zgc:92137
-0.040
XLOC-043846
0.125
ela2l
-0.040
gpc5a
0.117
prss1
-0.040
vsig10l
0.115
zgc:112160
-0.040
si:ch211-229i14.2
0.114
ctrb1
-0.040
plekhh2
0.111
bhmt
-0.039
BX663520.1
0.110
cpa1
-0.039
pimr192
0.108
c6ast4
-0.039
lhx8b
0.106
cpb1
-0.039
LOC101885413
0.103
CELA1 (1 of many)
-0.038
irx6a
0.103
zgc:136461
-0.038
si:dkey-222h21.10
0.102
cel.2
-0.038
CR931782.2
0.101
cpa4
-0.038
si:dkey-33c12.12
0.101
apoc1
-0.038
XLOC-011738
0.101
prss59.2
-0.038
si:dkey-34d22.2
0.099
cel.1
-0.038
LOC103910008
0.096
gamt
-0.038
CR450780.1
0.095
sycn.2
-0.037
BX649434.2
0.094
ela3l
-0.037
LOC101885611
0.093
prss59.1
-0.037
zmp:0000001031
0.093
spink4
-0.037
zgc:113030
0.093
si:dkey-14d8.6
-0.036
XLOC-040864
0.091
si:ch211-240l19.5
-0.035
rbm46
0.089
pdia2
-0.035
frya
0.084
cpa5
-0.035
si:dkey-19a16.12
0.084
endou
-0.035
si:dkey-76d14.2
0.083
fep15
-0.035
opn6a
0.083
ctrl
-0.034
zmp:0000000881
0.083
ssr1
-0.034
zgc:171977
0.082
pla2g1b
-0.034
BX539321.2
0.082
si:ch211-240l19.6
-0.034
olfcj1
0.079
erp27
-0.034