Daniocell
hsd17b14 (otic / lateral line)
hydroxysteroid (17-beta) dehydrogenase 14
ZFIN
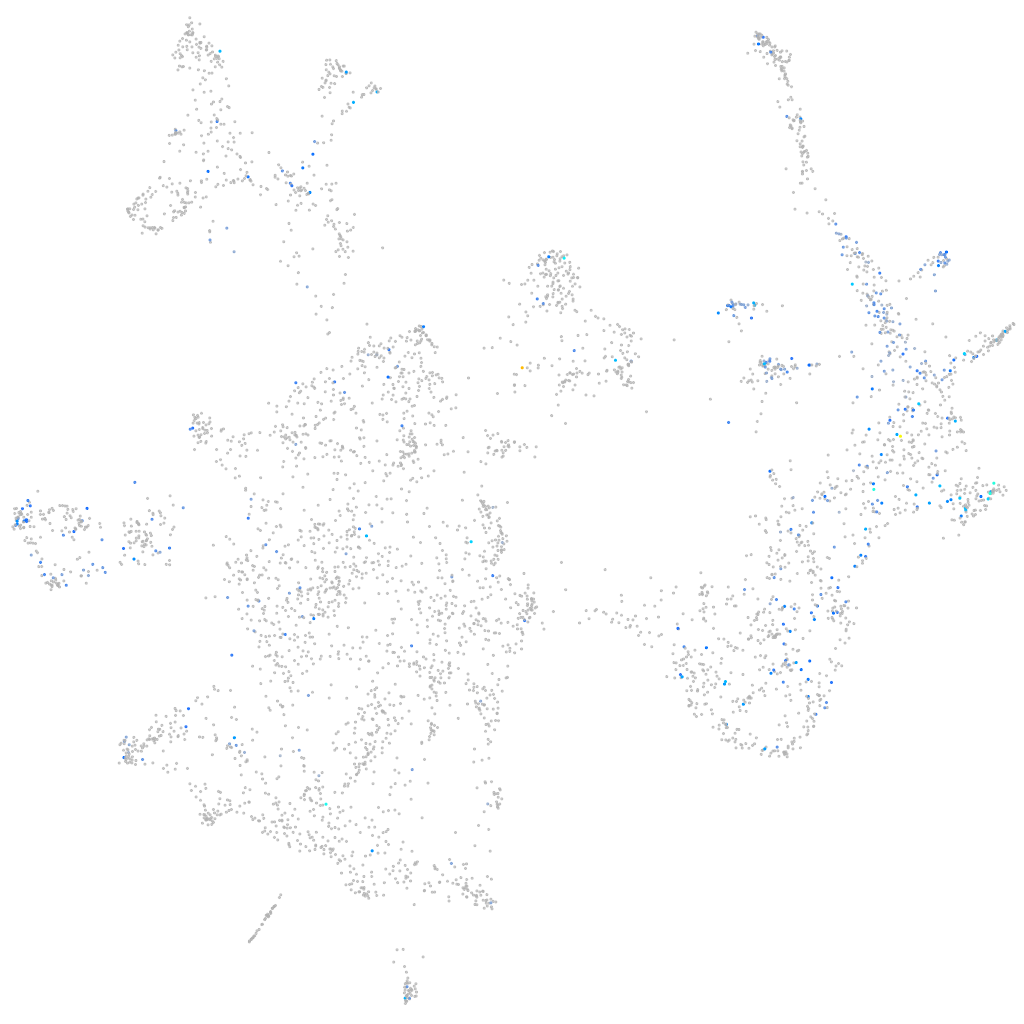
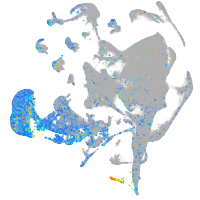
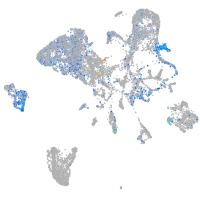
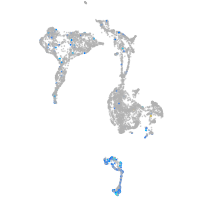
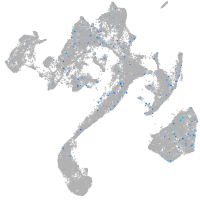
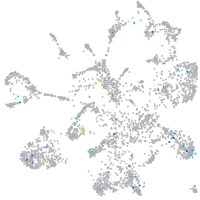
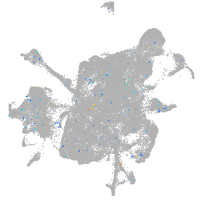
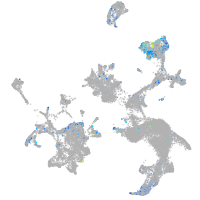
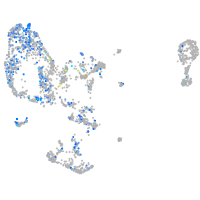
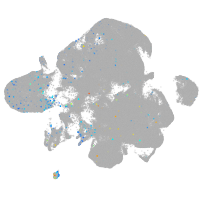
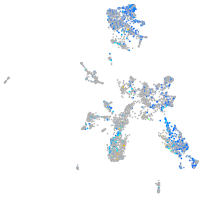
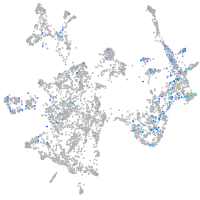
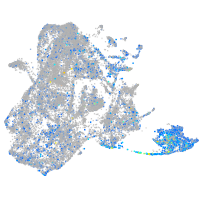
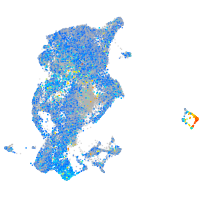
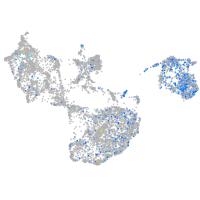
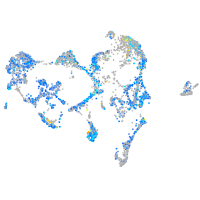
Gene expression UMAP
Display:
Expression
Stage
Other cell groups
all cells
blastomeres
PGCs
endoderm
axial mesoderm
muscle
mural cells /
non-skeletal muscle
mesenchyme
hematopoietic /
vasculature
pronephros
neural
spinal cord / glia
eye
taste / olfactory
otic / lateral line
epidermis
periderm
fin
ionocytes / mucous
pigment cells
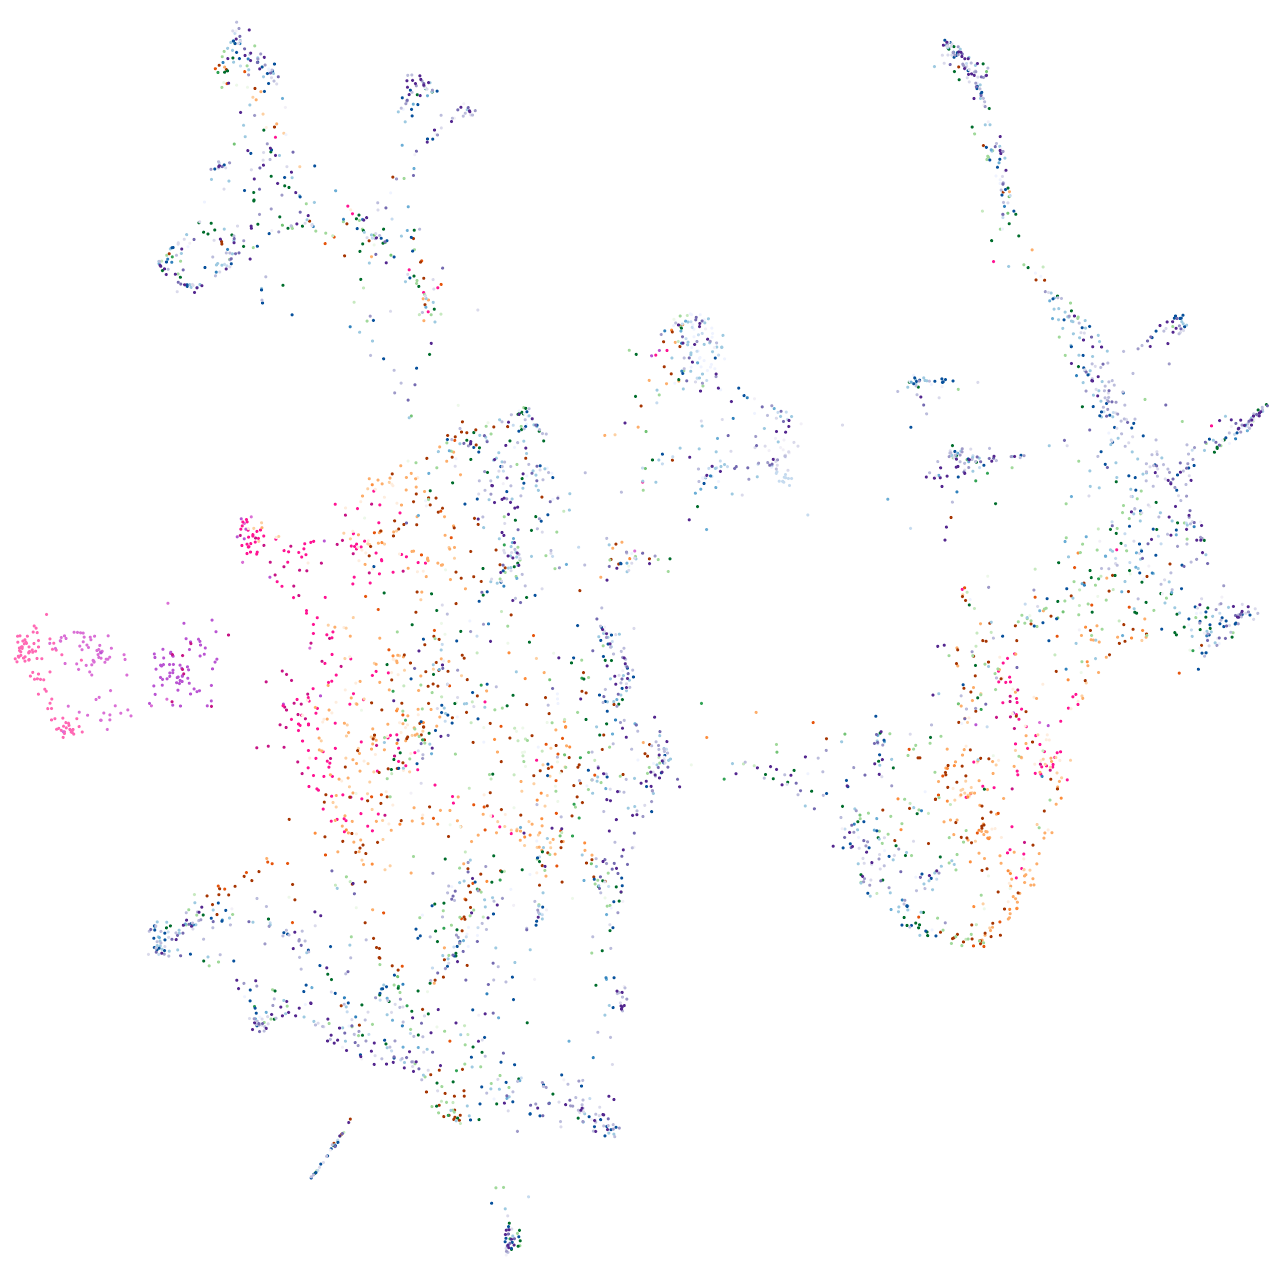
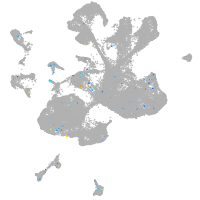
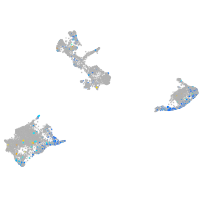
Expression by stage/cluster
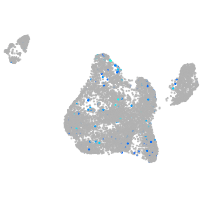
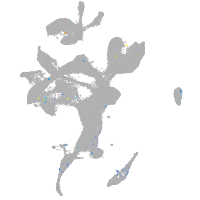
Correlated gene expression
Positive correlation
Negative correlation
Gene
r
Gene
r
krt1-c5
0.210
otomp
-0.128
krt15
0.208
col2a1a
-0.120
negaly6
0.201
col9a2
-0.115
spaca4l
0.199
stm
-0.104
si:ch211-103f14.3
0.198
col11a1a
-0.099
tnks1bp1
0.194
agr2
-0.098
tmem176l.4
0.189
col9a1a
-0.097
zgc:158343
0.189
col9a3
-0.097
gsnb
0.184
si:ch211-80h18.1
-0.095
cldnh
0.181
si:dkey-98f17.3
-0.094
si:dkey-205h13.2
0.180
col9a1b
-0.093
si:ch211-195b11.3
0.179
atp1a1a.4
-0.088
gmds
0.176
wfdc2
-0.087
wu:fb18f06
0.173
matn4
-0.083
si:dkey-103g5.3
0.173
sox10
-0.082
gsta.1
0.172
FP017215.1
-0.081
hopx
0.172
bricd5
-0.081
elf3
0.169
hmga2
-0.079
cldn8
0.167
ephb3
-0.078
moxd1l
0.166
slc4a4b
-0.076
si:dkey-87o1.2
0.166
col5a1
-0.075
irg1l
0.166
aif1l
-0.074
icn
0.166
LOC101882875
-0.073
gbgt1l3
0.164
cahz
-0.072
soul2
0.164
efhd1
-0.072
si:ch211-153b23.5
0.163
pcdh19
-0.072
tmem176l.3b
0.163
LO018188.1
-0.072
rab25a
0.162
nanos1
-0.071
LOC100147871
0.161
col11a2
-0.070
gbgt1l4
0.160
tnc
-0.069
cfl1l
0.160
si:ch211-133n4.6
-0.068
oclna
0.159
col2a1b
-0.068
gpa33a
0.159
pcdh10a
-0.068
abca12
0.158
AL954322.2
-0.067
selenom
0.157
dlx5a
-0.066