
hydroxysteroid (17-beta) dehydrogenase 10
ZFIN 
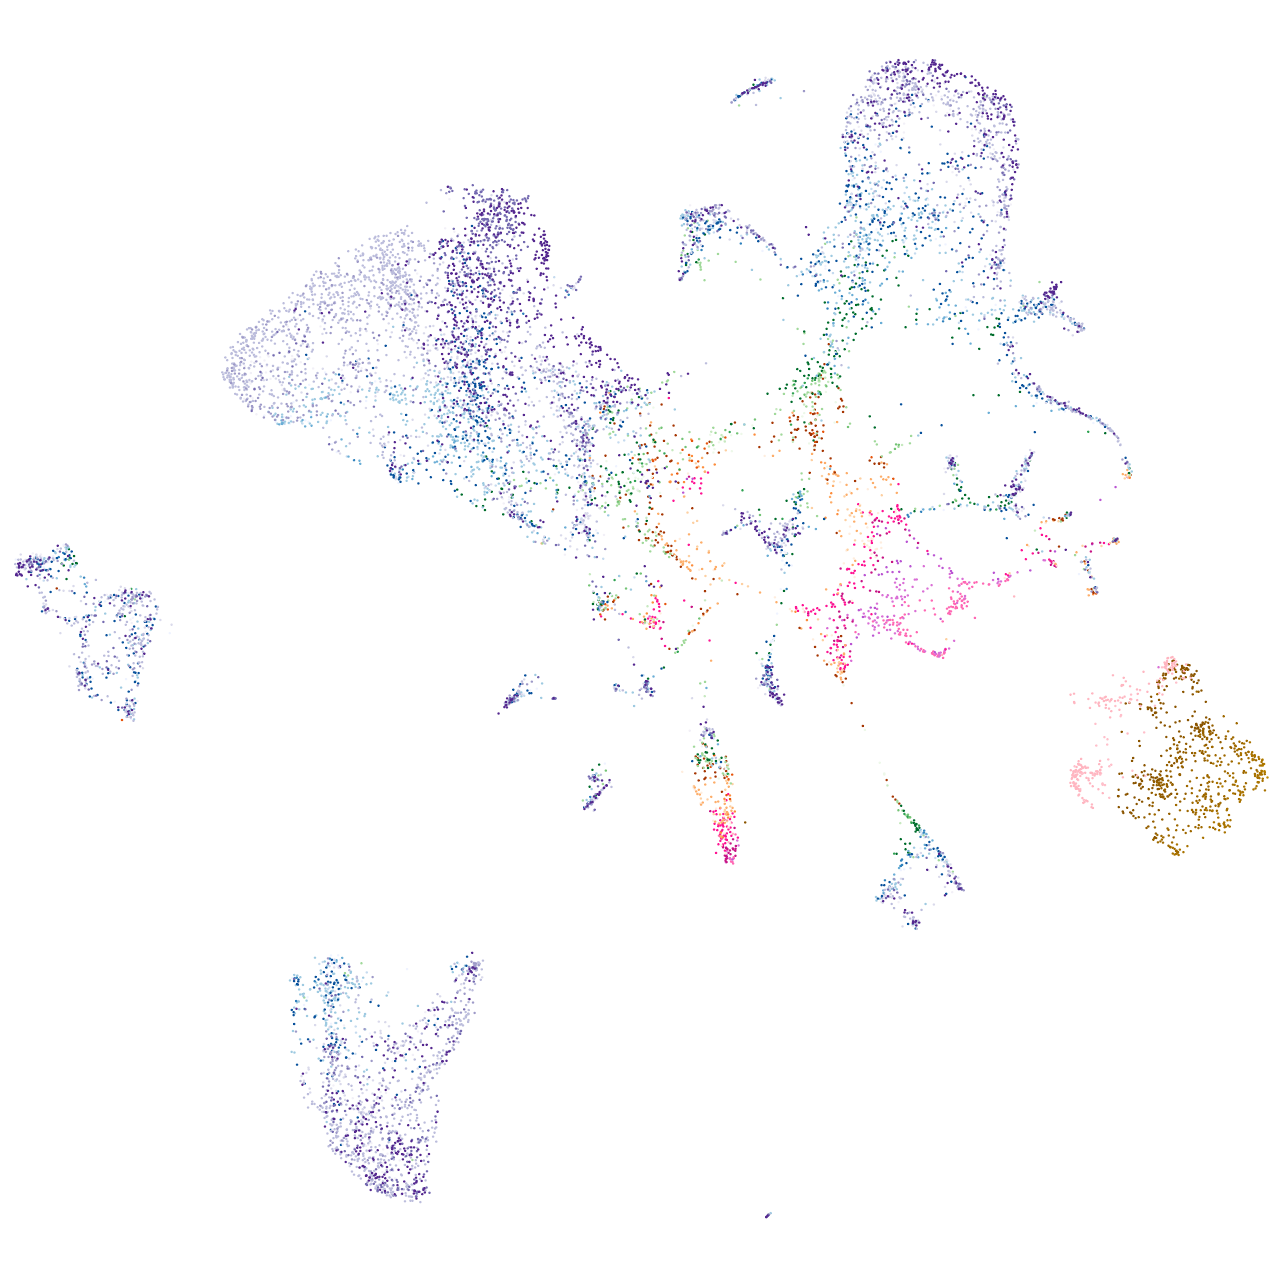
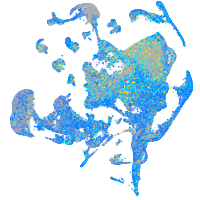
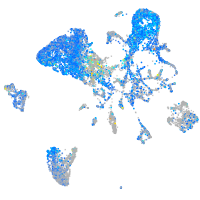
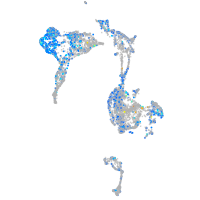
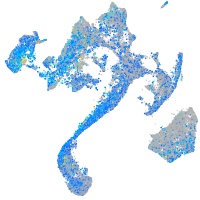
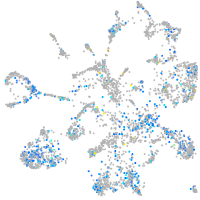
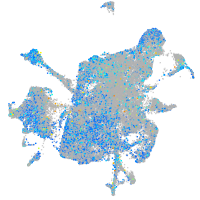
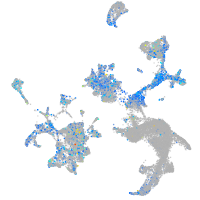
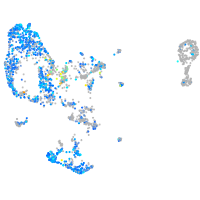
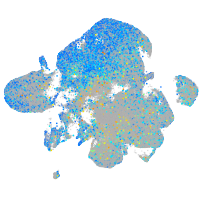
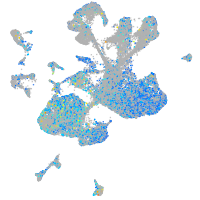
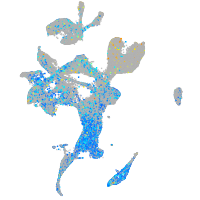
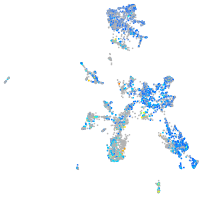
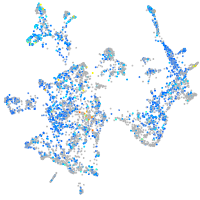
Gene expression UMAP


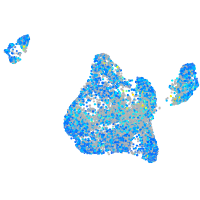
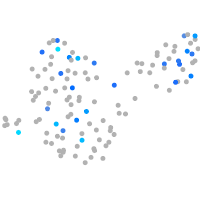
Expression by stage/cluster
Correlated gene expression
| Positive correlation | Negative correlation | ||
| Gene | r | Gene | r |
| atp5mc1 | 0.473 | marcksl1b | -0.206 |
| atp5f1b | 0.461 | hspb1 | -0.203 |
| atp5f1d | 0.439 | marcksb | -0.191 |
| sod1 | 0.437 | hmgb3a | -0.187 |
| fdx1 | 0.437 | akap12b | -0.185 |
| chchd10 | 0.434 | slc38a5b | -0.184 |
| phb2b | 0.433 | zgc:136461 | -0.176 |
| atp5f1c | 0.432 | rtn1a | -0.173 |
| srd5a2a | 0.431 | ctrl | -0.172 |
| sod2 | 0.431 | zgc:92137 | -0.172 |
| atp5mc3b | 0.431 | jpt1b | -0.171 |
| uqcrc1 | 0.430 | c6ast4 | -0.170 |
| atp5fa1 | 0.429 | cdh6 | -0.170 |
| gstr | 0.428 | si:ch211-152c2.3 | -0.169 |
| suclg1 | 0.426 | ela2l | -0.168 |
| prdx2 | 0.425 | amy2a | -0.164 |
| glud1b | 0.425 | sycn.2 | -0.163 |
| mdh1aa | 0.424 | glulb | -0.162 |
| gcshb | 0.424 | cpa1 | -0.161 |
| sult2st2 | 0.420 | ela2 | -0.160 |
| atp5mc3a | 0.420 | ela3l | -0.160 |
| atp5pb | 0.419 | stm | -0.160 |
| eno3 | 0.415 | pla2g1b | -0.158 |
| COX5B | 0.414 | zgc:112160 | -0.158 |
| cox7a2a | 0.413 | cx43.4 | -0.156 |
| prdx6 | 0.410 | cpa4 | -0.156 |
| prdx3 | 0.410 | cldn7b | -0.153 |
| scp2a | 0.408 | stard10 | -0.153 |
| atp5l | 0.406 | id1 | -0.153 |
| tpi1b | 0.406 | cel.2 | -0.152 |
| sdhdb | 0.406 | ctrb1 | -0.151 |
| hspd1 | 0.406 | cpb1 | -0.151 |
| ndufa10 | 0.406 | CELA1 (1 of many) | -0.151 |
| cox6b1 | 0.406 | prss59.1 | -0.151 |
| ndufb10 | 0.406 | cldnb | -0.150 |