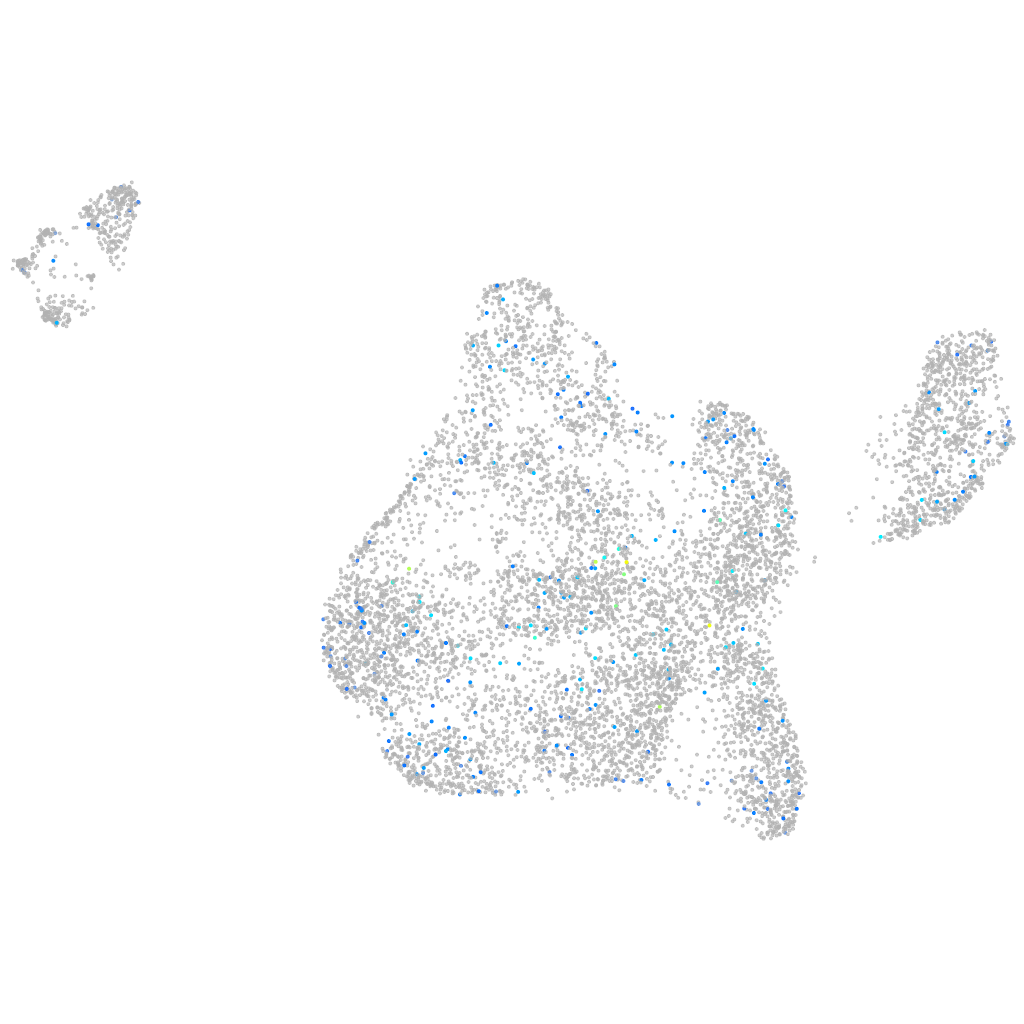
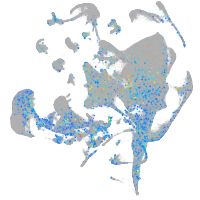
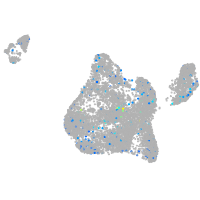
Daniocell
hpse (blastomeres)
heparanase
ZFIN
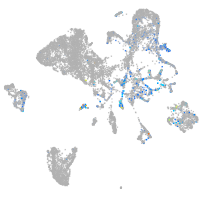
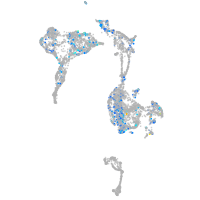
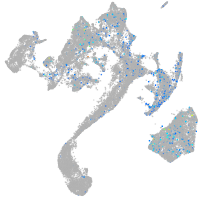
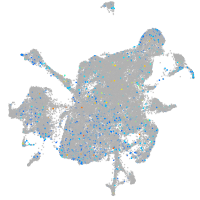
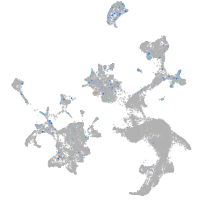
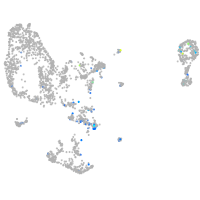
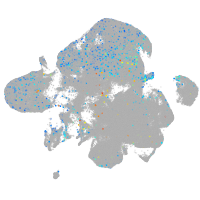
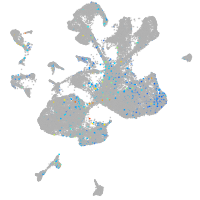
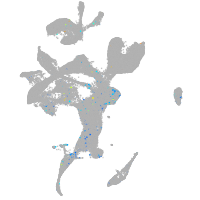
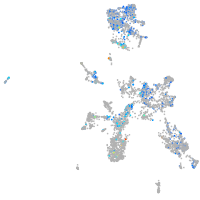
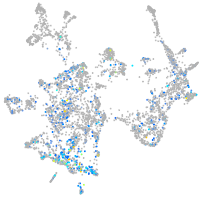
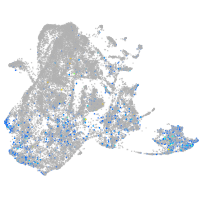
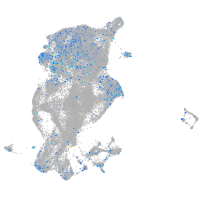
Gene expression UMAP
Display:
Expression
Stage
Other cell groups
all cells
blastomeres
PGCs
endoderm
axial mesoderm
muscle
mural cells /
non-skeletal muscle
mesenchyme
hematopoietic /
vasculature
pronephros
neural
spinal cord / glia
eye
taste / olfactory
otic / lateral line
epidermis
periderm
fin
ionocytes / mucous
pigment cells
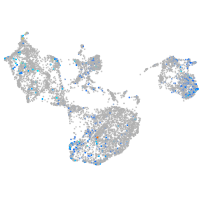
Expression by stage/cluster
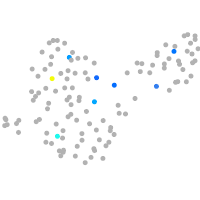
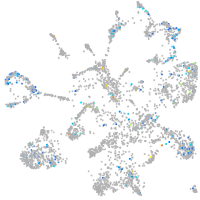
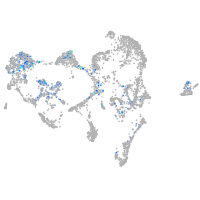
Correlated gene expression
Positive correlation
Negative correlation
Gene
r
Gene
r
LOC110437802
0.122
znf395a
-0.036
si:ch211-255f4.8
0.106
acaa1
-0.033
LOC110439848
0.102
tsc1a
-0.032
mhc1lda
0.098
bmi1b
-0.032
CU927887.1
0.097
terf1
-0.032
CR628324.1
0.097
prpf6
-0.030
cnksr3
0.095
qtrt2
-0.030
XLOC-000431
0.093
psph
-0.030
si:ch211-256a21.4
0.093
dcps
-0.030
pvalb1
0.093
chmp4c
-0.030
si:dkey-88n24.11
0.091
nup160
-0.030
BX511112.1
0.090
ppp4r2a
-0.029
si:dkey-221j11.3
0.090
wasf2
-0.029
CT573279.1
0.089
zgc:92606
-0.029
samsn1b
0.085
ube2d3
-0.029
doc2b
0.082
actr2a
-0.029
CR388378.1
0.081
mad2l2
-0.028
mov10b.1
0.080
hspa5
-0.028
CABZ01077217.2
0.079
coa5
-0.028
si:dkey-193p11.2
0.079
npc1
-0.028
si:dkey-24h22.5
0.077
cdca7a
-0.028
zgc:92275
0.077
hirip3
-0.028
CR848791.1
0.076
oclna
-0.028
il20ra
0.076
exd2
-0.028
si:ch211-232d10.3
0.075
uba3
-0.027
abcb4
0.075
znf740b
-0.027
ankrd31
0.075
ywhaqa
-0.027
BX276107.1
0.074
ctdnep1a
-0.027
LOC101884520
0.073
fam49a
-0.027
si:dkey-78k11.9
0.072
pbxip1a
-0.027
si:dkey-13e3.1
0.072
tfdp1b
-0.027
LOC110440150
0.072
pdcd5
-0.026
nuggc.2
0.071
mcts1
-0.026
CABZ01021592.1
0.071
hsd3b2
-0.026
casp7
0.071
CABZ01078055.1
-0.026