Daniocell
hopx (periderm)
HOP homeobox
ZFIN
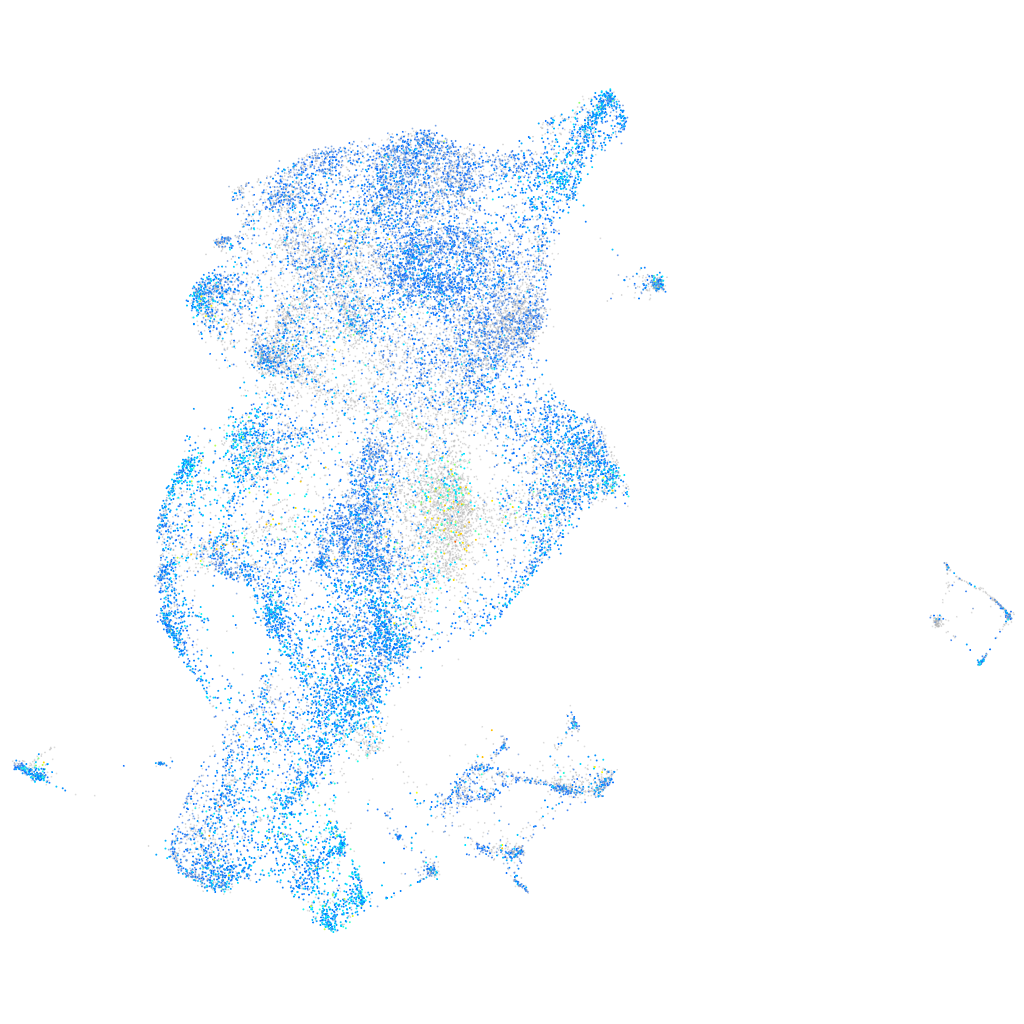
Gene expression UMAP
Display:
Expression
Stage
Other cell groups
all cells
blastomeres
PGCs
endoderm
axial mesoderm
muscle
mural cells /
non-skeletal muscle
mesenchyme
hematopoietic /
vasculature
pronephros
neural
spinal cord / glia
eye
taste / olfactory
otic / lateral line
epidermis
periderm
fin
ionocytes / mucous
pigment cells
Expression by stage/cluster
Correlated gene expression
Positive correlation
Negative correlation
Gene
r
Gene
r
zgc:153665
0.303
wu:fa03e10
-0.202
si:ch211-157c3.4
0.300
rhbg
-0.189
capns1b
0.274
zgc:158463
-0.182
cst14b.1
0.270
rplp2
-0.144
tmsb1
0.267
krtt1c19e
-0.137
anxa1b
0.262
pvalb2
-0.134
capns1a
0.250
pvalb1
-0.133
anxa1a
0.246
si:dkey-202l22.6
-0.133
zgc:174938
0.242
si:dkey-33c14.3
-0.133
capn2b
0.239
LOC110439372
-0.132
zgc:153867
0.238
ponzr3
-0.127
adh8b
0.236
si:dkeyp-51b9.3
-0.124
ywhabl
0.232
rpl6
-0.122
s100a10b
0.224
CU914622.2
-0.120
cd9b
0.222
actc1b
-0.120
krt92
0.221
si:dkey-151g10.6
-0.118
ap1s3b
0.220
rhcga
-0.117
arpc2
0.219
eevs
-0.114
mvp
0.219
sesn1
-0.111
mgst2
0.217
ch25hl1.1
-0.108
si:dkey-19b23.12
0.216
CABZ01072614.1
-0.106
gmds
0.214
si:ch211-207n23.2
-0.105
zgc:153284
0.214
si:dkey-247k7.2
-0.105
cfl1l
0.212
slx1b
-0.103
si:dkey-87o1.2
0.211
zgc:153932
-0.102
ANXA1 (1 of many)
0.211
rps29
-0.101
s100w
0.210
mylpfa
-0.098
krt99
0.209
CABZ01051602.1
-0.096
arpc3
0.209
CT027638.1
-0.094
cst14a.2
0.209
COX3
-0.094
vamp8
0.208
rps18
-0.094
si:ch211-195b11.3
0.207
apoa2
-0.092
jupa
0.207
rpl4
-0.092
pmm2
0.206
mylz3
-0.089
agr1
0.206
rpl3
-0.089