Daniocell
hist1h2a10 (taste / olfactory)
histone cluster 1 H2A family member 10
ZFIN
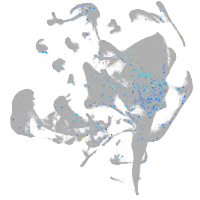
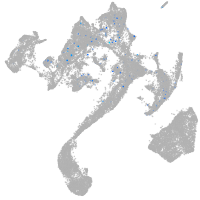
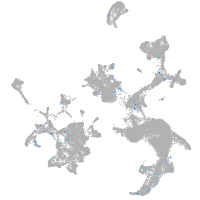
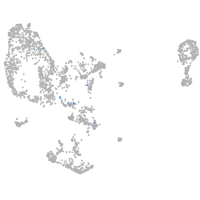
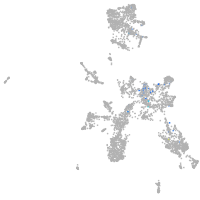
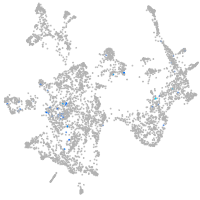
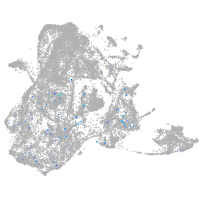
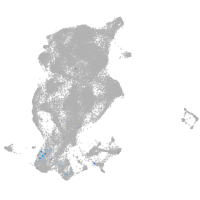
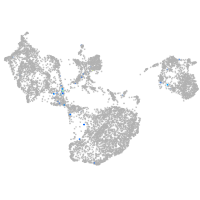
Gene expression UMAP
Display:
Expression
Stage
Other cell groups
all cells
blastomeres
PGCs
endoderm
axial mesoderm
muscle
mural cells /
non-skeletal muscle
mesenchyme
hematopoietic /
vasculature
pronephros
neural
spinal cord / glia
eye
taste / olfactory
otic / lateral line
epidermis
periderm
fin
ionocytes / mucous
pigment cells
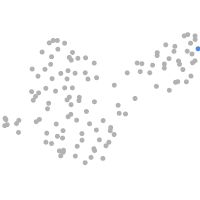
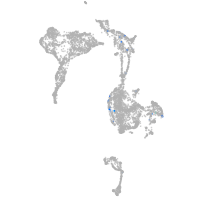
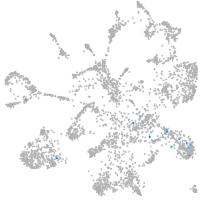
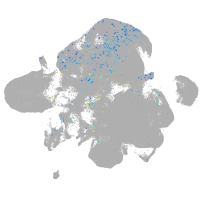
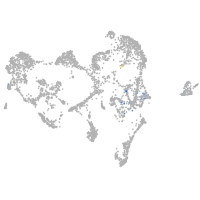
Expression by stage/cluster
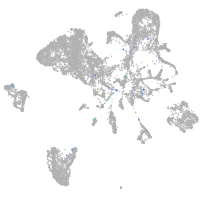
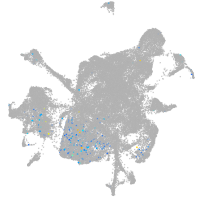
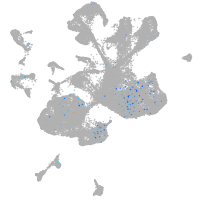
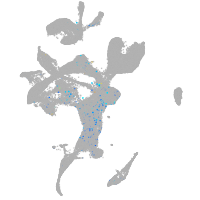
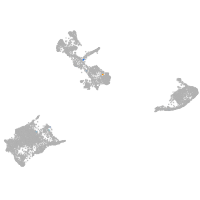
Correlated gene expression
Positive correlation
Negative correlation
Gene
r
Gene
r
XLOC-031033
0.358
txn
-0.085
znf1097
0.282
tmem59
-0.076
LOC110438254
0.255
ppdpfb
-0.075
slc19a3a
0.252
anxa5b
-0.074
BX005380.2
0.247
gstp1
-0.073
dre-let-7i
0.247
fthl27
-0.072
si:dkey-261m9.17
0.245
bik
-0.072
BX908799.1
0.241
mgst3b
-0.071
si:dkey-108k21.10
0.240
ap1s3b
-0.069
si:ch211-132p1.3
0.226
capns1b
-0.069
zgc:165555.3
0.224
gabarapa
-0.068
spc25
0.223
atp6v1e1b
-0.068
zgc:153405
0.223
selenow2b
-0.068
tulp1b
0.215
calm1a
-0.066
hist1h2a6
0.212
htatip2
-0.066
hist2h3c
0.209
tprg1
-0.065
zgc:110425
0.207
CR383676.1
-0.064
zgc:110216
0.202
ccni
-0.063
LOC103908875
0.201
zgc:65894
-0.063
si:ch1073-159d7.6
0.194
atp6v1g1
-0.062
ccna2
0.188
chga
-0.062
si:ch211-113a14.6
0.184
selenow1
-0.062
smc4
0.184
camk2n1a
-0.062
si:dkeyp-51g9.4
0.182
uchl1
-0.061
hist1h2a11
0.181
zgc:175088
-0.061
pbk
0.180
zgc:165573
-0.061
hist1h4l
0.178
tpi1b
-0.061
dlgap5
0.176
atp6v1h
-0.061
trim55a
0.173
map1aa
-0.061
zgc:110224
0.172
sncb
-0.061
top2a
0.172
vamp2
-0.060
anks1aa
0.168
rab6bb
-0.060
gja5a
0.167
ldhba
-0.060
mki67
0.167
calr
-0.060
kif14
0.165
syt1a
-0.060