Daniocell
hif1an (fin)
hypoxia inducible factor 1 subunit alpha inhibitor
ZFIN
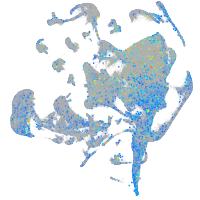
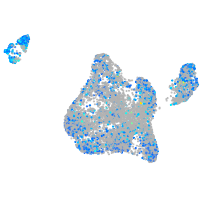
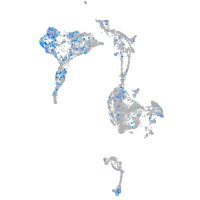
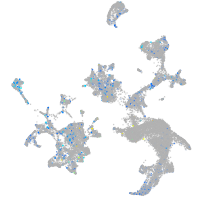
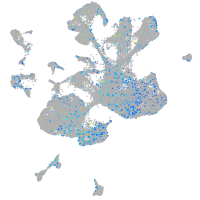
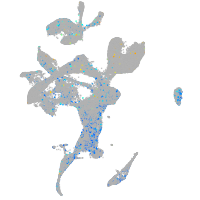
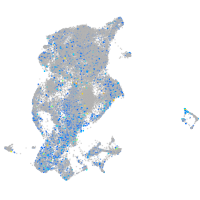
Gene expression UMAP
Display:
Expression
Stage
Other cell groups
all cells
blastomeres
PGCs
endoderm
axial mesoderm
muscle
mural cells /
non-skeletal muscle
mesenchyme
hematopoietic /
vasculature
pronephros
neural
spinal cord / glia
eye
taste / olfactory
otic / lateral line
epidermis
periderm
fin
ionocytes / mucous
pigment cells
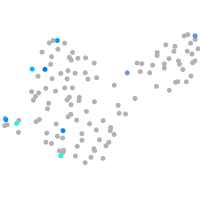
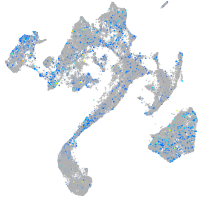
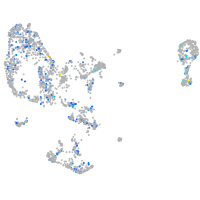
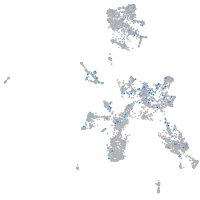
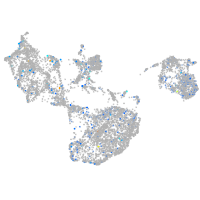
Expression by stage/cluster
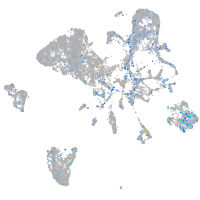
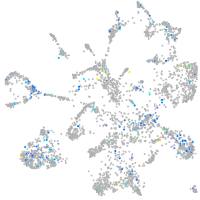
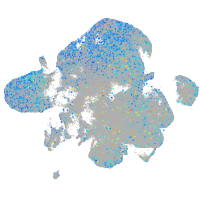
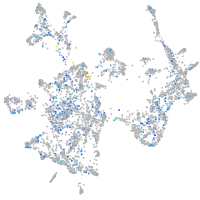
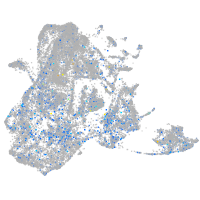
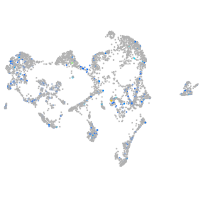
Correlated gene expression
Positive correlation
Negative correlation
Gene
r
Gene
r
RF00068
0.233
rpl29
-0.050
RF00410
0.231
rplp1
-0.045
BX511018.2
0.196
rps21
-0.044
si:ch73-361p23.3
0.180
rpl23a
-0.043
ssx2ipb
0.175
rps10
-0.041
si:ch211-270n8.4
0.175
rpl37
-0.040
lrrc53
0.170
rpl26
-0.038
CU464118.1
0.166
si:dkey-151g10.6
-0.036
CU633479.6
0.157
wnt2
-0.036
si:dkey-13n15.2
0.152
lygl1
-0.032
XLOC-016203
0.145
rpl27a
-0.032
LOC100537702
0.134
creg1
-0.032
LOC108183599
0.129
rps28
-0.031
zgc:56628
0.124
rpl39
-0.031
si:ch211-119c20.2
0.123
si:dkey-91f15.1
-0.030
abcc6a
0.123
fstb
-0.029
LOC101883668
0.122
ccl25b
-0.028
LOC103910009
0.122
zgc:77439
-0.028
LO018238.1
0.121
rps29
-0.027
evx2
0.119
rps26l
-0.027
bsna
0.118
rpl36a
-0.027
si:ch211-230g14.3
0.117
mmp30
-0.026
LOC108179652
0.116
apoa2
-0.026
LOC110437924.1
0.112
lrp1aa
-0.026
macc1
0.108
fam69c
-0.026
CR925803.1
0.107
dus3l
-0.026
CU655961.1
0.107
thbs4b
-0.026
LOC100005965
0.106
rpl34
-0.026
slc30a2
0.106
vbp1
-0.025
ifih1
0.105
myhz1.1
-0.025
LO018250.1
0.105
pnpla7b
-0.025
LRRC56
0.105
jdp2b
-0.024
kcna7
0.104
gpx4a
-0.024
LOC103910551
0.104
thbs3b
-0.024
gnrh2
0.102
CU693494.2
-0.024