Daniocell
gys1 (ionocytes / mucous-producing)
glycogen synthase 1 (muscle)
ZFIN
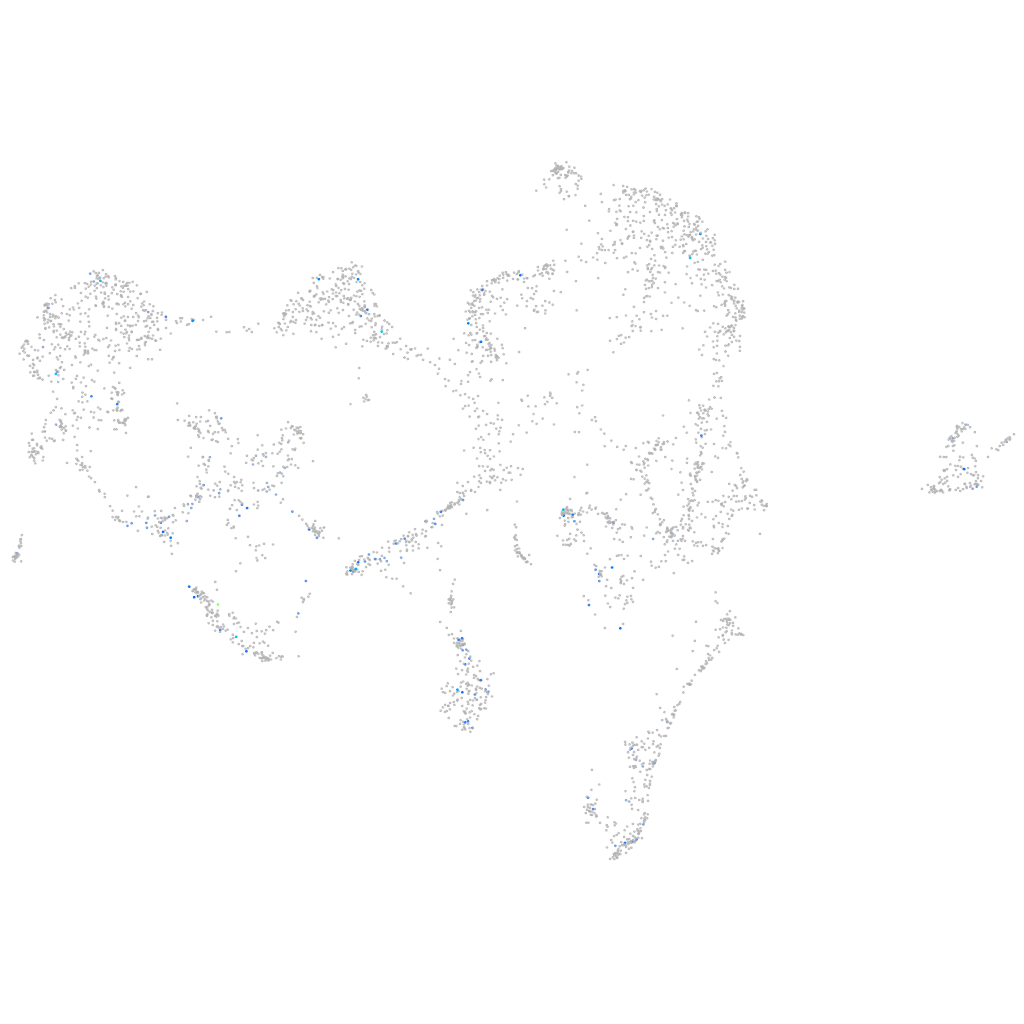
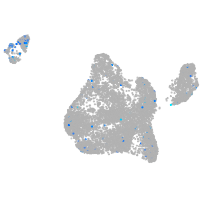
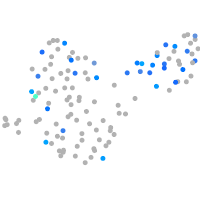
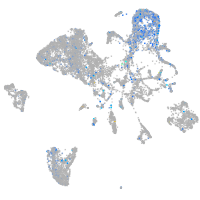
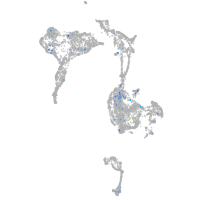
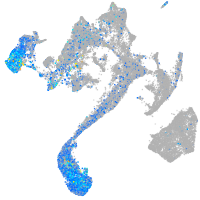
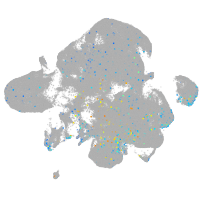
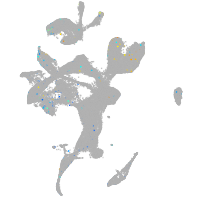
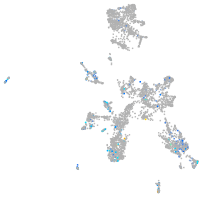
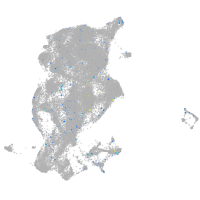
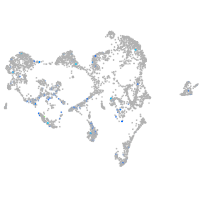
Gene expression UMAP
Display:
Expression
Stage
Other cell groups
all cells
blastomeres
PGCs
endoderm
axial mesoderm
muscle
mural cells /
non-skeletal muscle
mesenchyme
hematopoietic /
vasculature
pronephros
neural
spinal cord / glia
eye
taste / olfactory
otic / lateral line
epidermis
periderm
fin
ionocytes / mucous
pigment cells
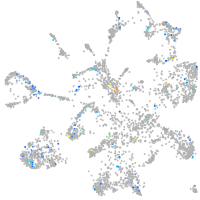
Expression by stage/cluster
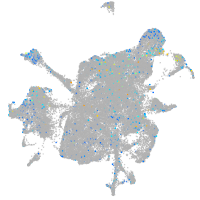
Correlated gene expression
Positive correlation
Negative correlation
Gene
r
Gene
r
LOC108180171
0.272
hmgb2a
-0.066
osbp2
0.193
hmgn3
-0.066
si:dkey-32e23.4
0.187
atp2a3
-0.063
CR589944.2
0.180
agr2
-0.059
asic4a
0.179
hmgn2
-0.057
B3GAT1
0.179
nucks1a
-0.056
mir199-3
0.177
galnt6
-0.056
SCARF2
0.162
h3f3a
-0.053
ypel2b
0.162
muc5.1
-0.052
LOC103911115
0.161
gtf2b
-0.052
CR925803.1
0.161
si:ch73-281n10.2
-0.052
mir132-2
0.161
tspan13a
-0.052
si:ch73-335l21.1
0.160
snrpd3l
-0.051
zgc:162612
0.159
zgc:154054
-0.049
BX511080.1
0.156
sdr16c5b
-0.049
si:ch211-43f4.1
0.155
srsf3b
-0.049
slc4a3
0.155
si:dkey-65b12.6
-0.049
si:dkey-222h21.3
0.155
h2afvb
-0.049
si:dkey-90a24.1
0.155
pou2f3
-0.049
LOC110438027
0.153
mki67
-0.048
si:dkey-32n7.9
0.152
foxa3
-0.048
si:ch1073-90m23.1
0.151
lmnb2
-0.048
kcnj8
0.149
si:ch73-1a9.3
-0.048
cilp
0.148
krt91
-0.048
ccdc170
0.147
b3gnt7
-0.047
dnah1
0.147
sytl2b
-0.047
cfap73
0.146
eif5a2
-0.047
si:dkeyp-72a4.1
0.142
ptmab
-0.047
si:rp71-1f1.5
0.139
snrpf
-0.047
cox5b2
0.139
icn
-0.047
chrna4b
0.138
ewsr1b
-0.047
fthl28
0.137
srsf7a
-0.047
asic1c
0.134
eif4ebp3l
-0.046
XLOC-032002
0.132
impad1
-0.046
rusc1
0.132
hmgb2b
-0.046