Daniocell
gulp1a (periderm)
GULP PTB domain containing engulfment adaptor 1a
ZFIN
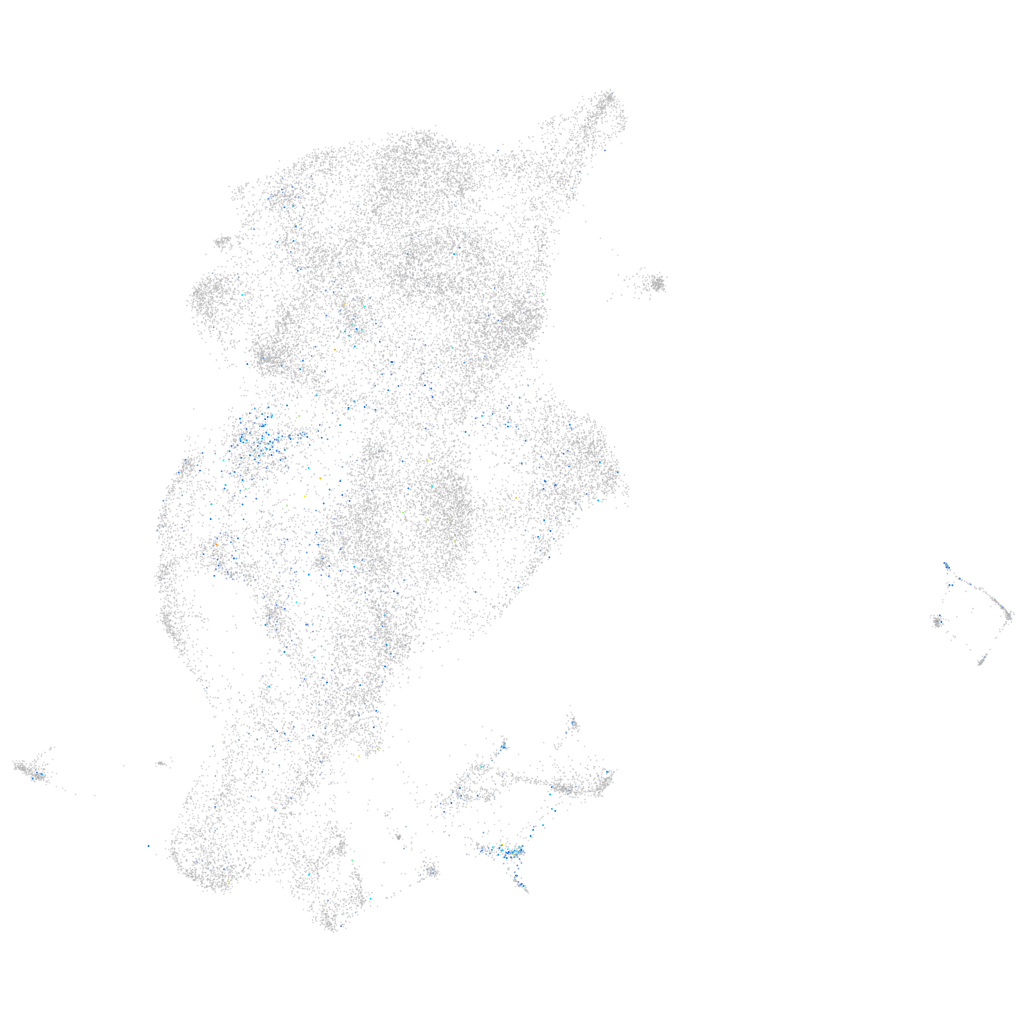
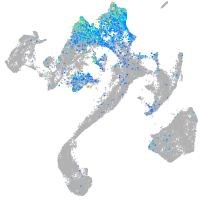
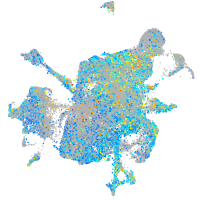
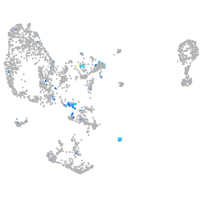
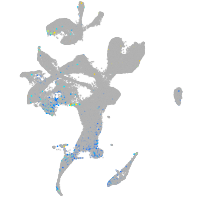
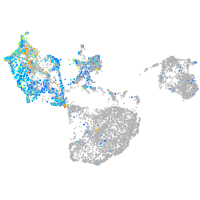
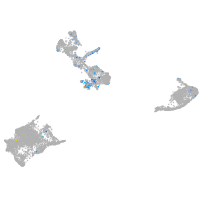
Gene expression UMAP
Display:
Expression
Stage
Other cell groups
all cells
blastomeres
PGCs
endoderm
axial mesoderm
muscle
mural cells /
non-skeletal muscle
mesenchyme
hematopoietic /
vasculature
pronephros
neural
spinal cord / glia
eye
taste / olfactory
otic / lateral line
epidermis
periderm
fin
ionocytes / mucous
pigment cells
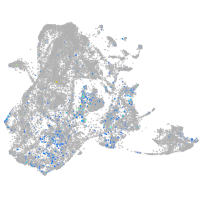
Expression by stage/cluster
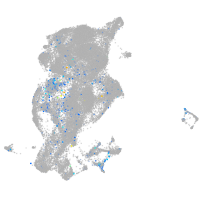
Correlated gene expression
Positive correlation
Negative correlation
Gene
r
Gene
r
lamc3
0.124
krt17
-0.090
pdgfrl
0.122
krt4
-0.068
tmem176
0.121
cyt1
-0.067
col5a1
0.118
s100a10b
-0.064
si:ch211-212k18.9
0.118
si:dkey-16p21.8
-0.063
ms4a17a.11
0.117
anxa2a
-0.059
pmp22a
0.108
krt5
-0.056
fmoda
0.107
s100w
-0.046
col1a2
0.105
cyt1l
-0.046
si:ch1073-291c23.2
0.105
icn
-0.046
apof
0.100
krt91
-0.041
znf1004
0.100
anxa1a
-0.040
nlrc8
0.100
mgst1.2
-0.039
vwde
0.099
ahcy
-0.039
col11a1b
0.099
cfl1l
-0.038
pimr187
0.098
si:dkey-202l22.6
-0.037
mfap2
0.098
agr1
-0.037
sparc
0.098
si:dkey-7c18.24
-0.036
scn4ab
0.096
DSG2
-0.036
si:ch211-106j24.1
0.096
si:ch211-166a6.5
-0.034
dcn
0.096
tdh
-0.034
col6a3
0.095
icn2
-0.034
CABZ01076968.1
0.095
wu:fb18f06
-0.034
ltbp1
0.094
si:ch211-157c3.4
-0.034
col5a2a
0.094
cyp2y3
-0.034
stab1
0.094
ubap1la
-0.029
olfml3b
0.094
pof1b
-0.029
tmem119b
0.093
si:dkey-223p19.1
-0.028
tgfbi
0.092
mapre1a
-0.027
bhmt
0.092
capgb
-0.027
col18a1b
0.091
eppk1
-0.027
vstm4a
0.091
si:ch211-217k17.9
-0.027
ntd5
0.091
si:ch211-195b11.3
-0.027
col1a1b
0.090
XLOC-041945
-0.027
col6a1
0.089
AL929237.1
-0.026