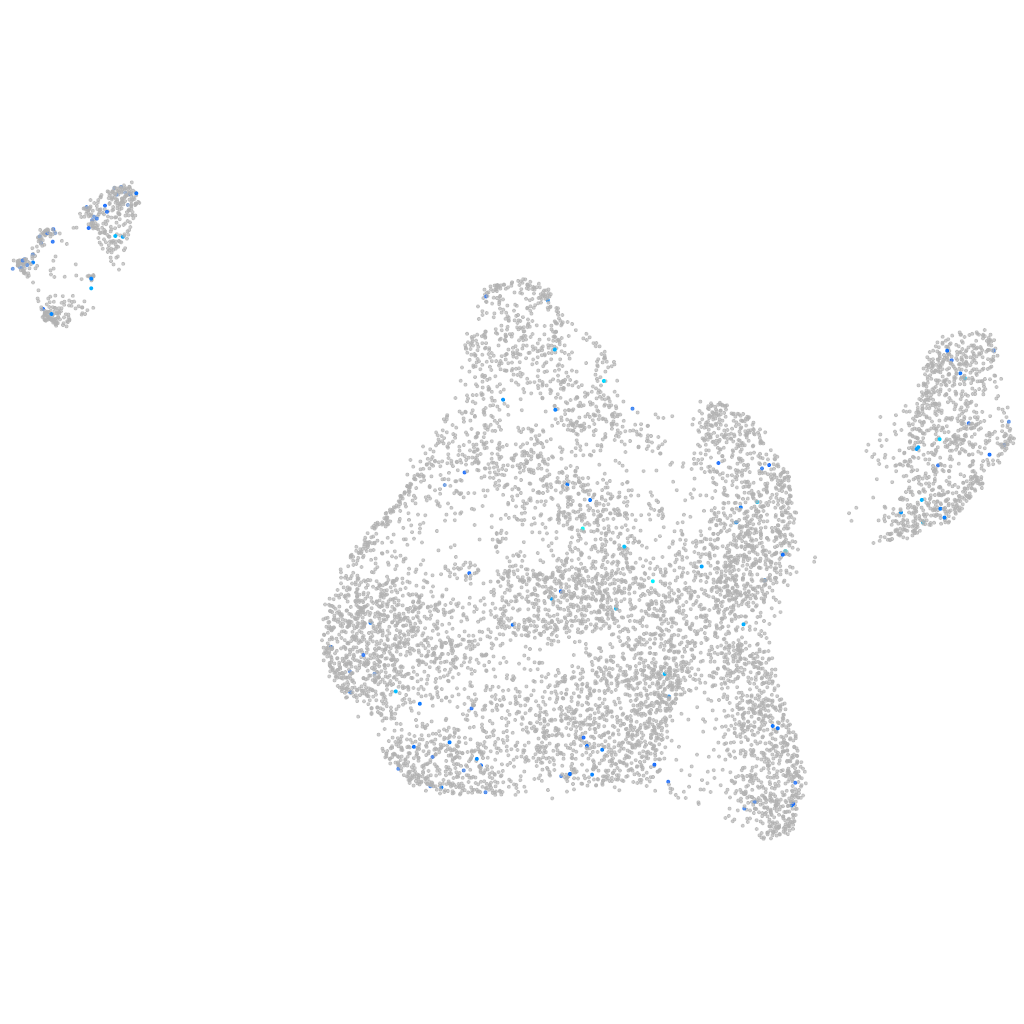
Daniocell
guf1 (blastomeres)
"GUF1 homolog, GTPase"
ZFIN
Gene expression UMAP
Display:
Expression
Stage
Other cell groups
all cells
blastomeres
PGCs
endoderm
axial mesoderm
muscle
mural cells /
non-skeletal muscle
mesenchyme
hematopoietic /
vasculature
pronephros
neural
spinal cord / glia
eye
taste / olfactory
otic / lateral line
epidermis
periderm
fin
ionocytes / mucous
pigment cells
Expression by stage/cluster
Correlated gene expression
Positive correlation
Negative correlation
Gene
r
Gene
r
LOC101885053
0.191
stm
-0.072
CR854827.2
0.139
si:ch211-152c2.3
-0.069
vasna
0.138
hnrnpa0b
-0.067
timp4.3
0.126
si:ch73-1a9.3
-0.066
nppa
0.124
dynll1
-0.066
ifit16
0.124
hspb1
-0.066
XLOC-002238
0.123
hmgn6
-0.065
BX276107.1
0.118
eef1a1l1
-0.064
si:dkey-17m8.2
0.118
aldob
-0.062
hnf4a
0.114
hmga1a
-0.060
LOC101886439
0.113
anp32e
-0.059
FP340271.1
0.112
marcksl1b
-0.059
f9b
0.106
rpl36a
-0.058
mir25
0.106
rps2
-0.057
CR848742.1
0.103
si:ch211-222l21.1
-0.057
CR847944.2
0.103
rps20
-0.056
si:dkey-38n4.2
0.103
rplp1
-0.056
zgc:110353
0.103
rps15a
-0.055
BX601646.1
0.102
hmgb2a
-0.054
tex33
0.100
rps13
-0.054
fhad1
0.099
rps7
-0.054
CT573163.1
0.098
rps27a
-0.053
hoxc12a
0.097
cirbpb
-0.053
LOC110438239
0.095
rps16
-0.052
BX682558.1
0.094
rpl22
-0.052
hamp
0.094
rps12
-0.052
si:dkey-13m1.2
0.094
khdrbs1a
-0.050
klhdc10
0.092
rps23
-0.050
dclre1b
0.091
snrpd1
-0.049
si:ch73-334d15.1
0.089
rps21
-0.049
XLOC-006258
0.089
rps9
-0.048
mpp4a
0.088
rps4x
-0.048
mmp17a
0.088
rpl29
-0.047
tmprss13a
0.087
polr3gla
-0.046
itih3a
0.087
srsf5a
-0.046