Daniocell
gtpbp1l (pronephros)
"GTP binding protein 1, like"
ZFIN
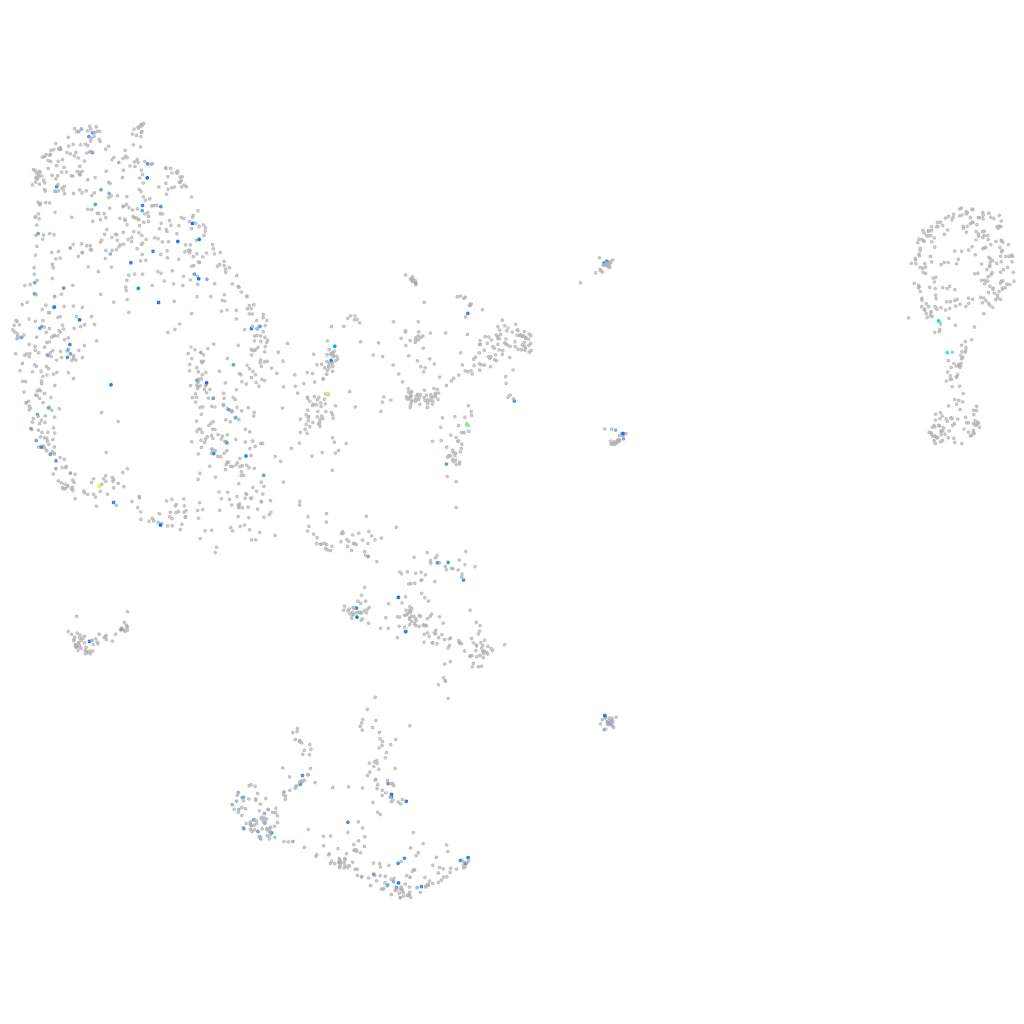
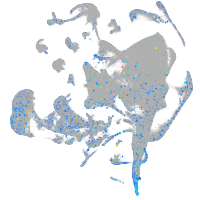
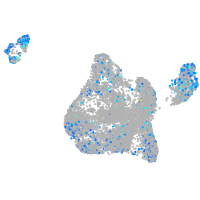
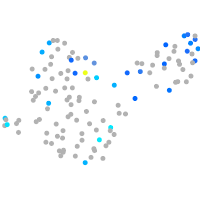
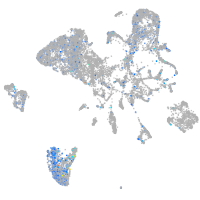
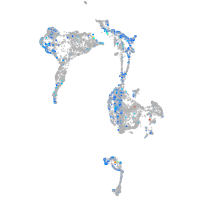
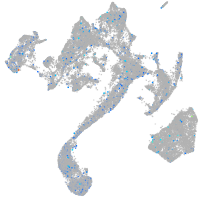
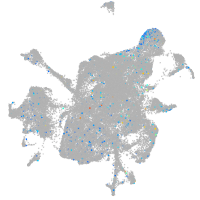
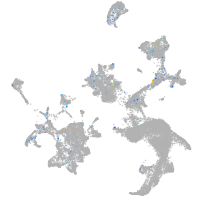
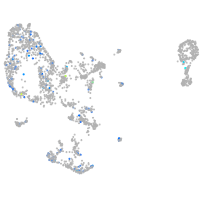
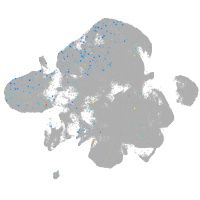
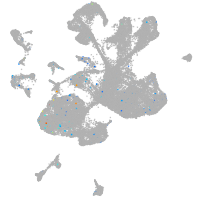
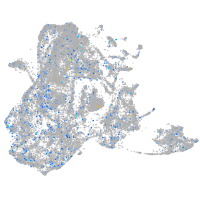
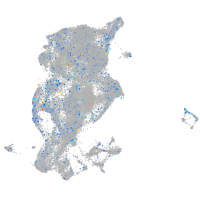
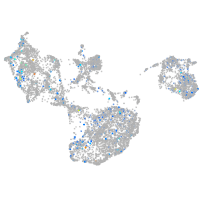
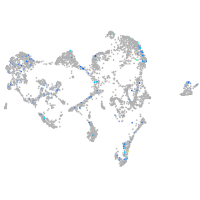
Gene expression UMAP
Display:
Expression
Stage
Other cell groups
all cells
blastomeres
PGCs
endoderm
axial mesoderm
muscle
mural cells /
non-skeletal muscle
mesenchyme
hematopoietic /
vasculature
pronephros
neural
spinal cord / glia
eye
taste / olfactory
otic / lateral line
epidermis
periderm
fin
ionocytes / mucous
pigment cells
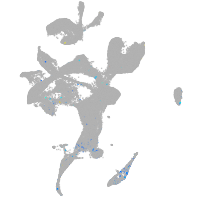
Expression by stage/cluster
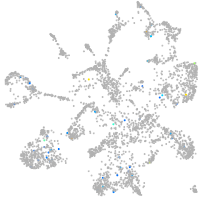
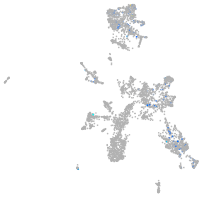
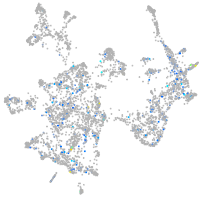
Correlated gene expression
Positive correlation
Negative correlation
Gene
r
Gene
r
LOC110438216
0.266
marcksl1b
-0.079
LOC110440068
0.265
cx43.4
-0.075
LOC110437781
0.247
marcksb
-0.074
si:ch73-190m4.1
0.245
snrnp70
-0.072
sox2ot
0.240
hnrnpm
-0.070
XLOC-034192
0.238
akap12b
-0.069
opn9
0.236
wu:fb97g03
-0.068
ftr14l
0.233
cxcl12a
-0.068
XLOC-010242
0.221
apoc1
-0.067
AL954861.1
0.221
luc7l3
-0.067
XLOC-042707
0.221
nucks1a
-0.067
si:ch73-151m17.5
0.220
hspb1
-0.066
sc:d189
0.220
si:ch73-1a9.3
-0.066
snai3
0.218
rbbp4
-0.065
LOC103909784
0.211
snrpd3l
-0.065
znf1127
0.208
hmgb3a
-0.064
fam102aa
0.206
hmga1a
-0.063
ubtd1a
0.200
tuba1a
-0.063
CR855257.2
0.197
rrp15
-0.062
LOC101882857
0.196
cdx4
-0.062
nts
0.187
bms1
-0.061
CR847936.10
0.186
NC-002333.4
-0.061
galnt8b.1
0.185
hmgb2b
-0.061
BX950187.1
0.181
zranb2
-0.061
cyp2ae1
0.179
bcl7a
-0.060
gys2
0.179
ptmab
-0.060
hoxa4a
0.179
zmp:0000000624
-0.060
iffo2a
0.179
tia1
-0.060
derl3
0.177
hnrnpa1b
-0.060
fam19a5a
0.177
stmn1a
-0.059
hepacama
0.172
eloa
-0.059
CR354610.2
0.170
hnrnph1l
-0.059
neu3.2
0.168
rsl1d1
-0.059
sorbs2a
0.166
wdr61
-0.059
ttc22
0.165
mtdhb
-0.059