Daniocell
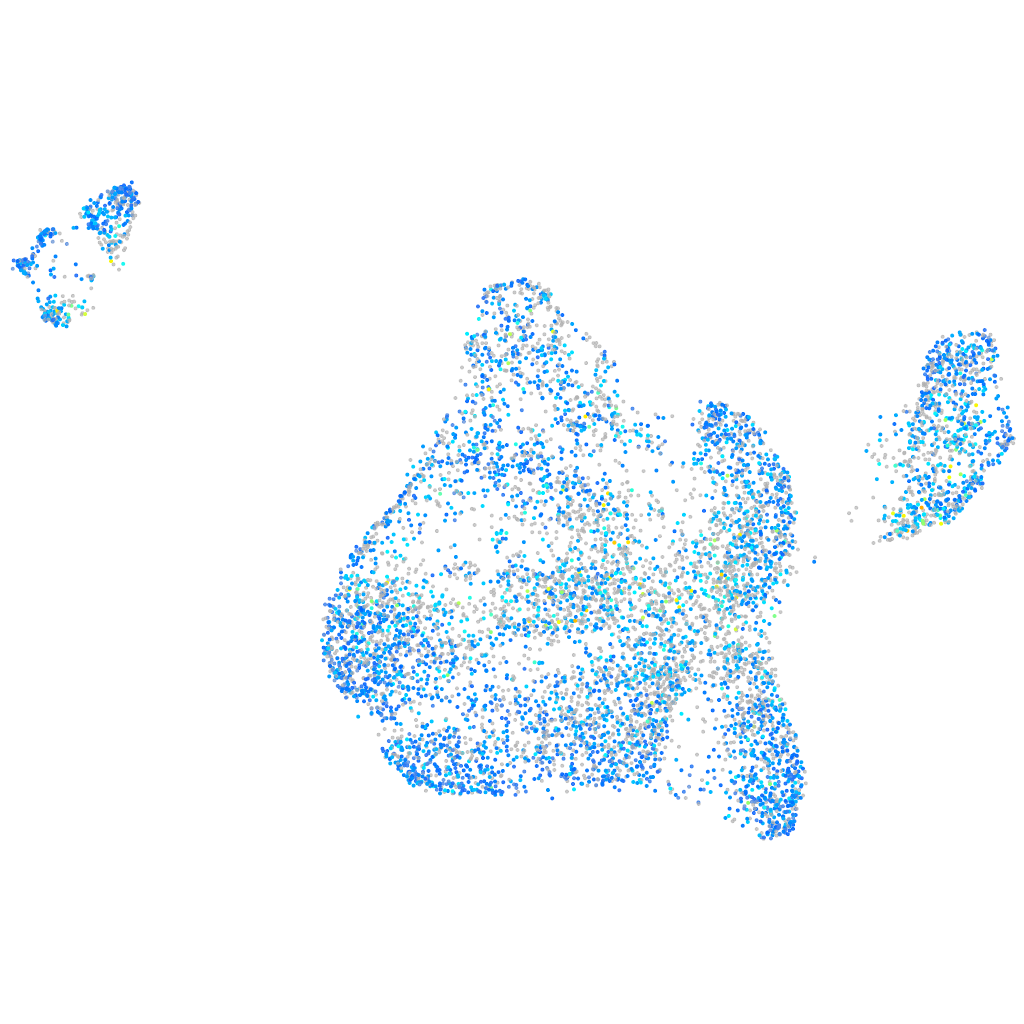
gstr (blastomeres)
glutathione S-transferase rho
ZFIN
Gene expression UMAP
Display:
Expression
Stage
Other cell groups
all cells
blastomeres
PGCs
endoderm
axial mesoderm
muscle
mural cells /
non-skeletal muscle
mesenchyme
hematopoietic /
vasculature
pronephros
neural
spinal cord / glia
eye
taste / olfactory
otic / lateral line
epidermis
periderm
fin
ionocytes / mucous
pigment cells
Expression by stage/cluster
Correlated gene expression
Positive correlation
Negative correlation
Gene
r
Gene
r
luc7l3
0.079
NC-002333.4
-0.069
hyou1
0.072
hnrnpa0b
-0.039
nasp
0.069
hspb1
-0.037
mphosph10
0.068
ifnphi3
-0.034
ube2g1a
0.068
tagln2
-0.034
tia1
0.067
lpar6a
-0.033
mmgt1
0.067
hmgb2a
-0.032
gtf2a1
0.066
XLOC-043001
-0.032
mphosph6
0.066
ptcd2
-0.031
si:dkey-68o6.5
0.066
si:ch211-152c2.3
-0.031
dnajc1
0.066
eef1a1l1
-0.031
psip1a
0.065
her12
-0.030
prpf40a
0.063
dsg2l
-0.030
ywhaz
0.063
zgc:161973
-0.029
atp5fa1
0.061
sox32
-0.029
rac1a
0.060
znf319b
-0.029
si:ch211-214j24.10
0.060
si:ch211-226h8.15
-0.029
rnf114
0.060
LOC110439327
-0.029
zgc:56106
0.060
dlx1a
-0.028
rbm26
0.059
hltf
-0.028
tpm3
0.059
sox2
-0.028
ktn1
0.059
CABZ01113812.1
-0.028
prdx1
0.059
stpg1
-0.027
zgc:175088
0.059
si:ch73-109d9.1
-0.027
snx27b
0.058
alox5b.3
-0.027
cdc6
0.058
LOC103911803
-0.027
si:dkeyp-93d12.1
0.058
si:ch211-285f17.1
-0.027
pfn2
0.057
XLOC-042556
-0.027
psap
0.057
BX323074.2
-0.027
ehmt1b
0.057
XLOC-039146
-0.027
ttf1
0.057
CABZ01102115.1
-0.026
slu7
0.057
cirbpb
-0.026
eif2b4
0.057
slc7a3b
-0.026
zp3d.1
0.057
PSTK
-0.026
serbp1a
0.057
grik1b
-0.026