Daniocell
gstp2 (blastomeres)
glutathione S-transferase pi 2
ZFIN
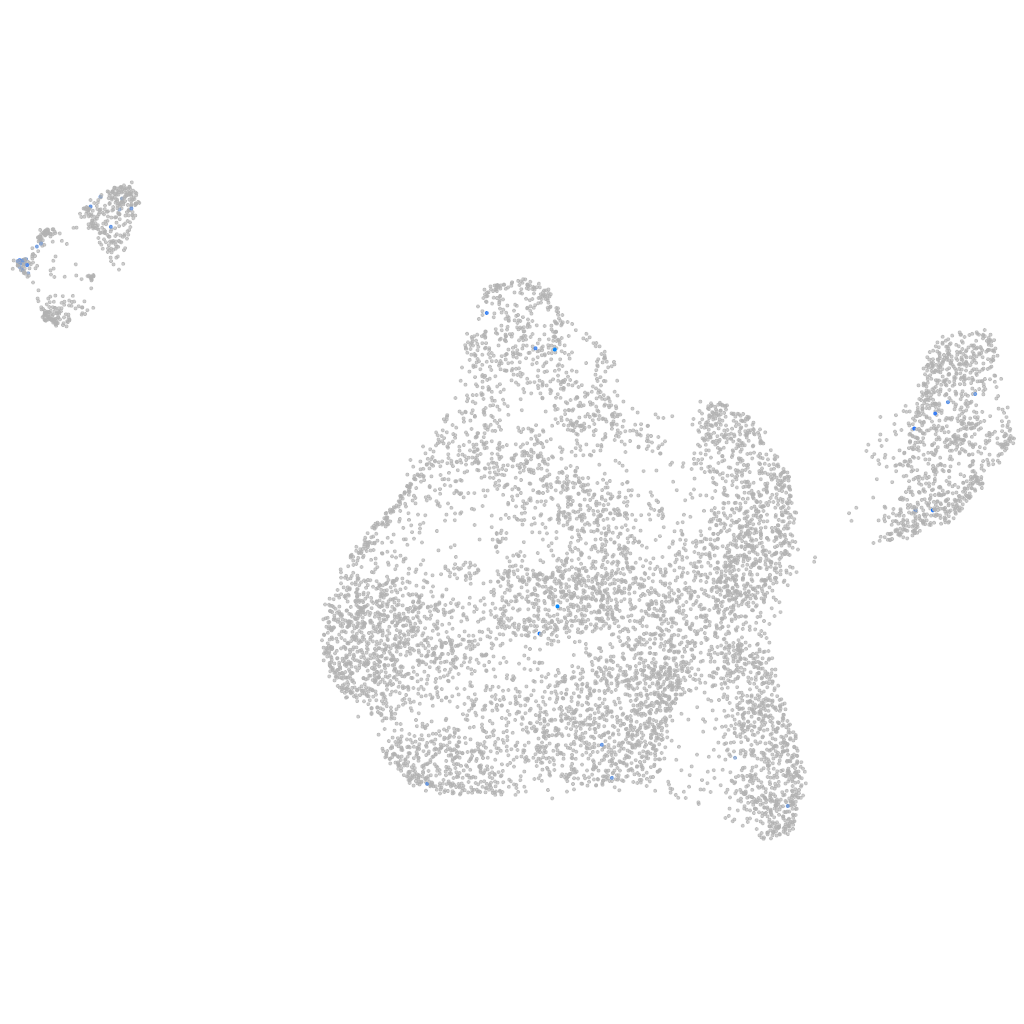
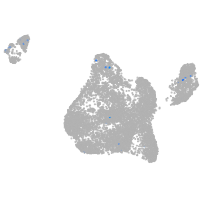
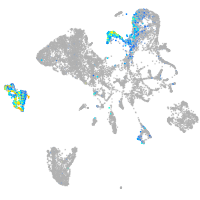
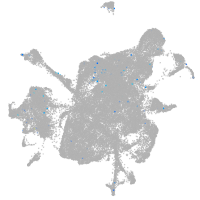
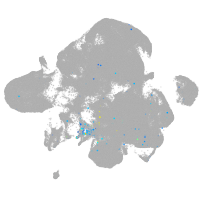
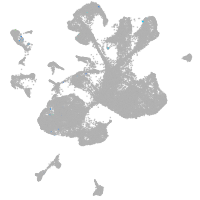
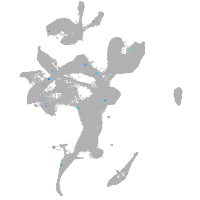
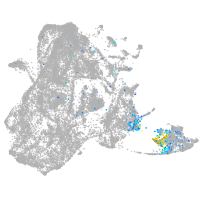
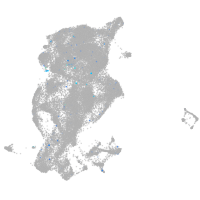
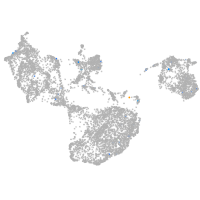
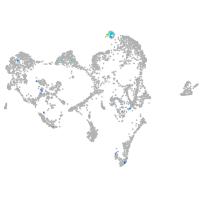
Gene expression UMAP
Display:
Expression
Stage
Other cell groups
all cells
blastomeres
PGCs
endoderm
axial mesoderm
muscle
mural cells /
non-skeletal muscle
mesenchyme
hematopoietic /
vasculature
pronephros
neural
spinal cord / glia
eye
taste / olfactory
otic / lateral line
epidermis
periderm
fin
ionocytes / mucous
pigment cells
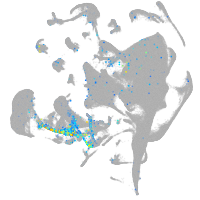
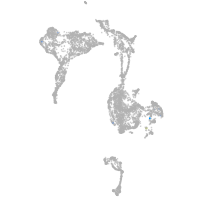
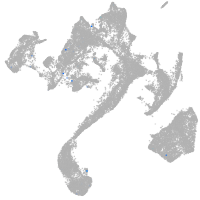
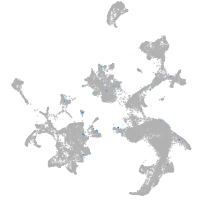
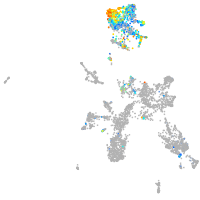
Expression by stage/cluster
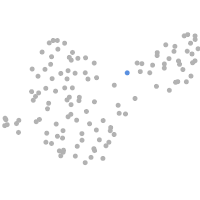
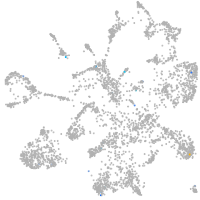
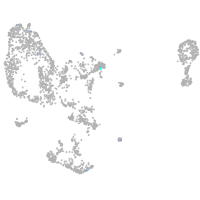
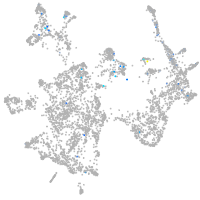
Correlated gene expression
Positive correlation
Negative correlation
Gene
r
Gene
r
nppa
0.287
stm
-0.083
LOC110439350
0.238
hnrnpa0b
-0.078
AL935199.1
0.231
marcksl1b
-0.077
lipca
0.224
aldob
-0.076
si:dkey-9i23.14
0.224
khdrbs1a
-0.076
zmp:0000001069
0.224
cirbpb
-0.075
LOC103911030
0.212
hspb1
-0.073
CU682604.1
0.188
si:ch73-1a9.3
-0.072
GUCY1A2
0.185
hmgn6
-0.071
CU570781.1
0.178
hmgb2a
-0.070
si:dkey-163f12.6
0.173
si:ch211-222l21.1
-0.067
tgm1l3
0.166
polr3gla
-0.065
XLOC-043072
0.165
dynll1
-0.062
XLOC-021244
0.164
hmga1a
-0.061
slitrk3a
0.162
rplp1
-0.061
si:dkey-183c6.8
0.159
si:ch211-152c2.3
-0.061
socs7
0.156
rplp0
-0.061
AL928650.1
0.154
sox19a
-0.059
CR847897.1
0.154
npm1a
-0.059
tmc4
0.153
eef1a1l1
-0.059
TC2N
0.153
ybx1
-0.058
si:ch211-165i18.2
0.151
rps5
-0.055
CU683879.1
0.141
si:dkey-56m19.5
-0.054
il17a/f2
0.141
atp1b1a
-0.053
znf1034
0.137
rplp2l
-0.053
rbl2
0.133
rpl36
-0.053
crygm6
0.128
asb11
-0.052
LOC110437988
0.125
hnrnpa1b
-0.052
c5
0.124
srsf5a
-0.050
si:dkey-58f10.4
0.124
rpl10
-0.049
BX649328.3
0.124
anp32e
-0.049
rab6bb
0.121
sox3
-0.049
ccl25b
0.121
si:ch1073-80i24.3
-0.047
mcoln2
0.119
rps7
-0.047
fam219ab
0.118
rpl35a
-0.047