Daniocell
gsdf (mural cells / non-skeletal muscle)
gonadal somatic cell derived factor
ZFIN
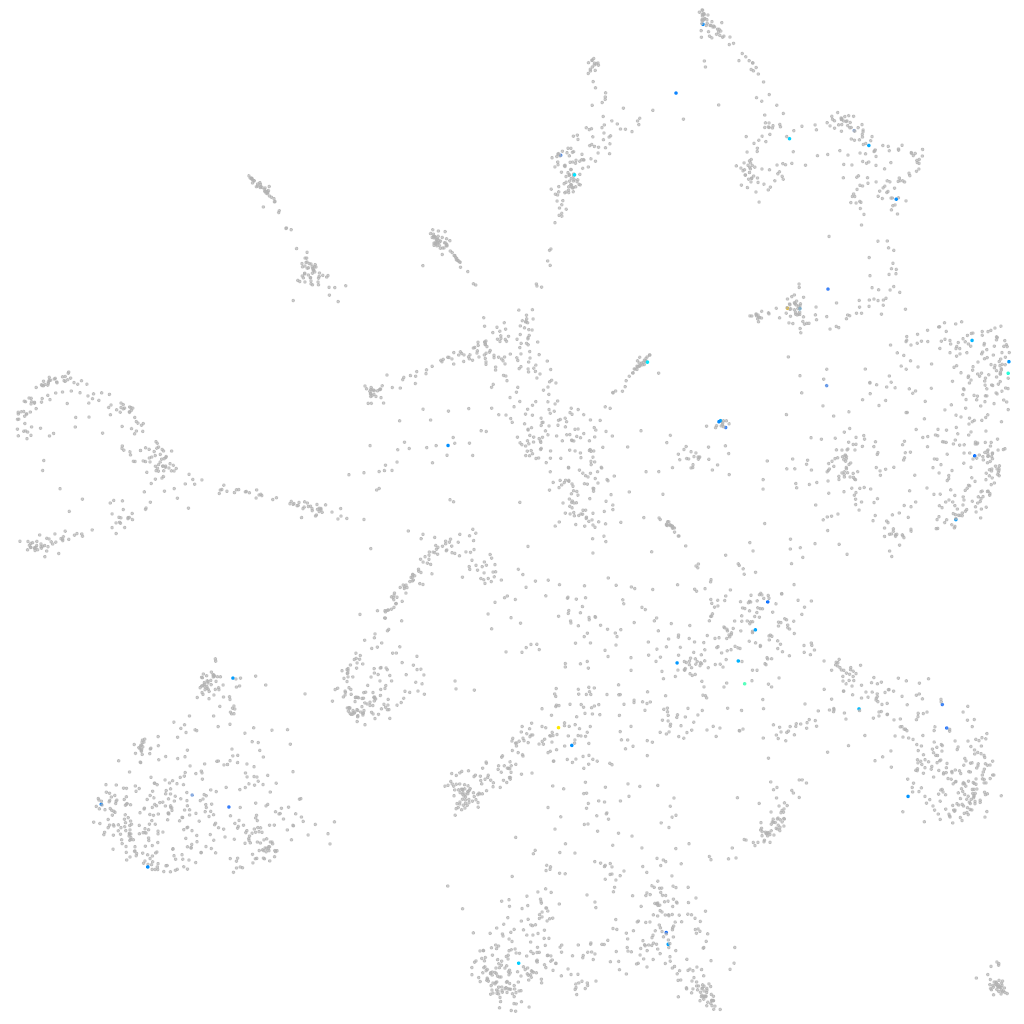
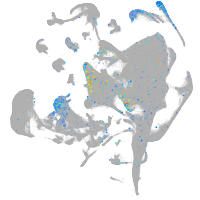
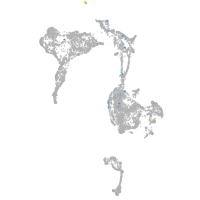
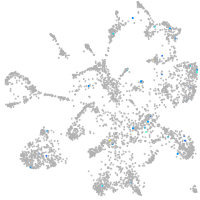
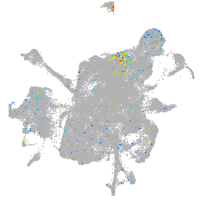
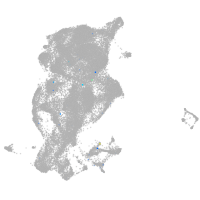
Gene expression UMAP
Display:
Expression
Stage
Other cell groups
all cells
blastomeres
PGCs
endoderm
axial mesoderm
muscle
mural cells /
non-skeletal muscle
mesenchyme
hematopoietic /
vasculature
pronephros
neural
spinal cord / glia
eye
taste / olfactory
otic / lateral line
epidermis
periderm
fin
ionocytes / mucous
pigment cells
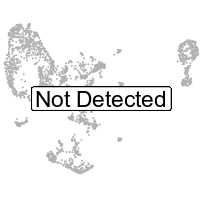
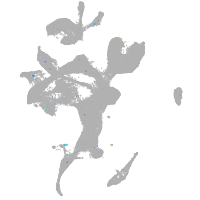
Expression by stage/cluster
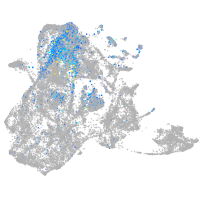
Correlated gene expression
Positive correlation
Negative correlation
Gene
r
Gene
r
LOC100535286
0.344
mfap2
-0.048
si:ch211-223g7.6
0.220
psmc5
-0.040
CU019663.1
0.194
cfl1
-0.039
LO017951.1
0.192
gdi2
-0.039
XLOC-030307
0.189
col4a2
-0.037
LOC103911264
0.181
angptl5
-0.036
CABZ01051877.1
0.171
hmgn6
-0.036
LOC570405.1
0.171
mplkip
-0.036
st14a
0.167
col5a1
-0.035
si:ch211-251g8.5
0.155
bgnb
-0.034
CR381579.3
0.154
col5a2a
-0.034
itgam
0.152
col1a2
-0.033
LOC110437930
0.151
rgmb
-0.033
fas
0.149
ctsa
-0.033
CR749763.1
0.149
grinab
-0.032
CU462914.1
0.149
serinc1
-0.032
malt2
0.149
plpp3
-0.032
CABZ01078734.1
0.148
aktip
-0.032
XLOC-006561
0.148
kdm5bb
-0.031
mir9-2
0.148
id2a
-0.031
col17a1a
0.146
cnot8
-0.031
si:dkey-91f15.1
0.144
barx1
-0.031
CR627496.1
0.140
pdia3
-0.031
XLOC-042514
0.135
lamb1a
-0.031
itga3a
0.133
atf4a
-0.030
si:ch211-288g17.4
0.132
zgc:86598
-0.030
otop2
0.132
acp1
-0.030
ftr22
0.132
hmgn7
-0.030
dennd2db
0.129
foxl1
-0.030
col5a3b
0.128
slc25a55a
-0.030
CU693494.2
0.128
gadd45ab
-0.030
LOC101882326
0.126
actb2
-0.030
CABZ01112732.1
0.126
rrbp1a
-0.030
XLOC-016189
0.123
loxl2b
-0.029
fpgt
0.122
mylka
-0.029