Daniocell
gpa33a (mural cells / non-skeletal muscle)
"glycoprotein A33 (transmembrane), paralog a"
ZFIN
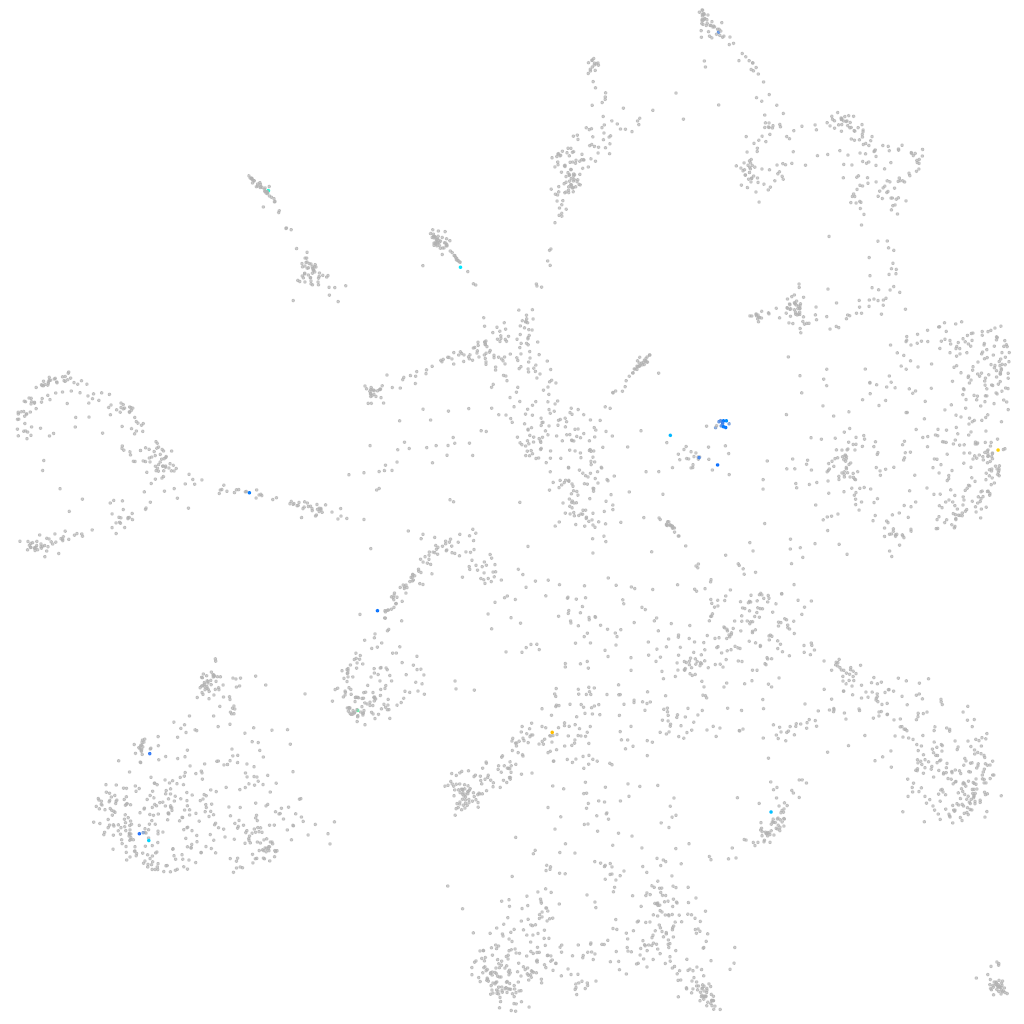
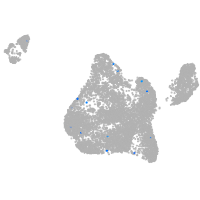
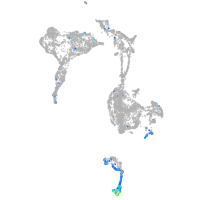
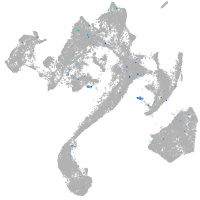
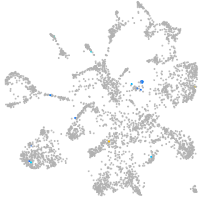
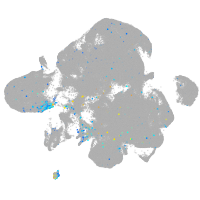
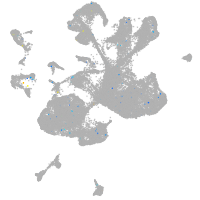
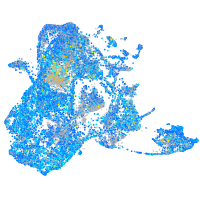
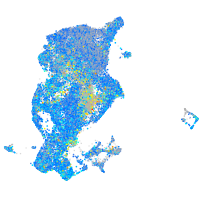
Gene expression UMAP
Display:
Expression
Stage
Other cell groups
all cells
blastomeres
PGCs
endoderm
axial mesoderm
muscle
mural cells /
non-skeletal muscle
mesenchyme
hematopoietic /
vasculature
pronephros
neural
spinal cord / glia
eye
taste / olfactory
otic / lateral line
epidermis
periderm
fin
ionocytes / mucous
pigment cells
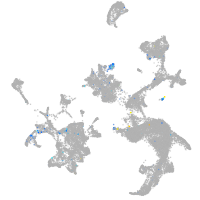
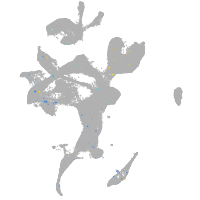
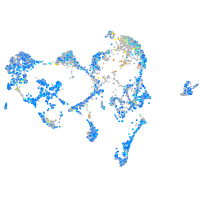
Expression by stage/cluster
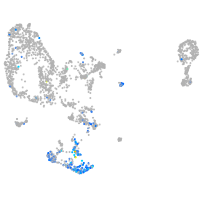
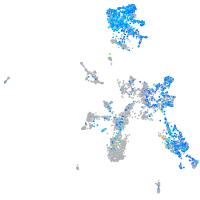
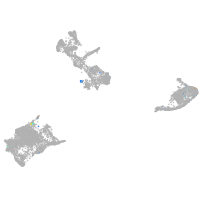
Correlated gene expression
Positive correlation
Negative correlation
Gene
r
Gene
r
si:dkeyp-34f6.4
0.385
rps9
-0.050
fabp10b
0.318
si:ch211-286o17.1
-0.043
prss60.2
0.304
col6a3
-0.043
cacna1sb
0.284
si:dkey-261h17.1
-0.043
si:dkey-12e7.4
0.277
fkbp1aa
-0.040
rgl3a
0.263
fbn2b
-0.039
si:dkey-27o4.1
0.261
rpl15
-0.039
CABZ01043166.1
0.250
atp1a1a.1
-0.036
abi3b
0.247
lama4
-0.036
uts2a
0.222
dad1
-0.036
st14a
0.220
tmem88b
-0.035
si:ch73-97h19.2
0.220
hmga2
-0.034
epgn
0.217
rpl22l1
-0.034
zgc:113223
0.213
itga5
-0.032
ecrg4b
0.212
podxl
-0.032
si:ch211-15p9.2
0.212
hmgn7
-0.031
si:dkey-283b1.7
0.208
foxf1
-0.031
stx11b.2
0.206
fzd7a
-0.031
col17a1a
0.198
calua
-0.031
LOC101883647
0.194
si:ch211-133n4.4
-0.031
ch25hl1.1
0.194
XLOC-002639
-0.031
XLOC-014427
0.194
fkbp7
-0.030
spaca4l
0.193
cpn1
-0.030
msnb
0.190
atp5f1c
-0.030
BX005454.1
0.188
arpc4l
-0.029
cldn1
0.182
lhfpl2a
-0.029
si:dkey-91f15.1
0.180
ppib
-0.029
derl3
0.178
cdh2
-0.029
si:ch73-296e2.3
0.175
selenof
-0.029
si:rp71-77l1.1
0.171
rpz5
-0.029
cldni
0.171
map1lc3b
-0.029
col5a3b
0.170
tspan36
-0.028
LOC100536112
0.169
XLOC-033137
-0.028
LOC101884781
0.169
mt-nd1
-0.028
LOC100537265
0.168
reck
-0.028