Daniocell
gosr2 (taste / olfactory)
golgi SNAP receptor complex member 2
ZFIN
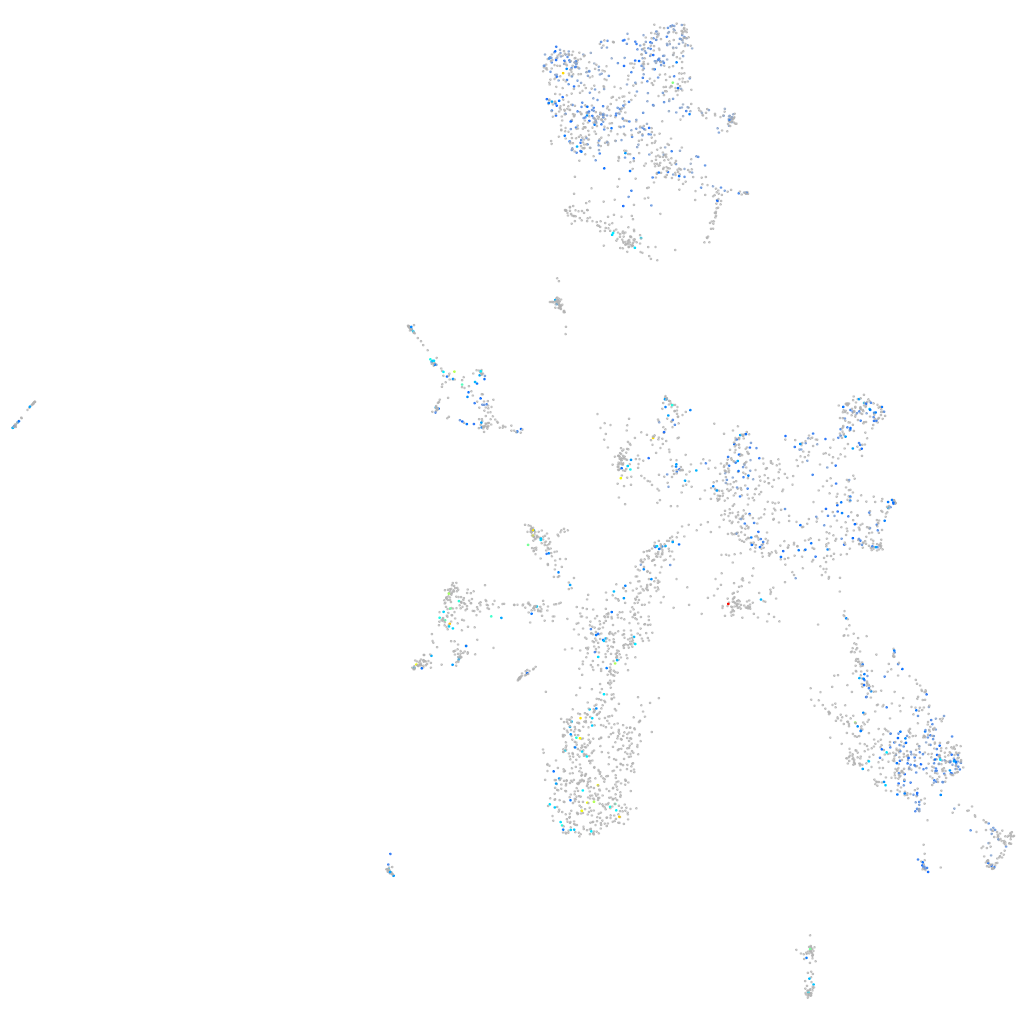
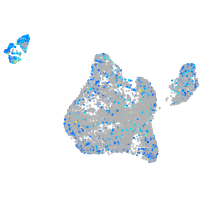
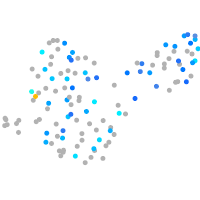
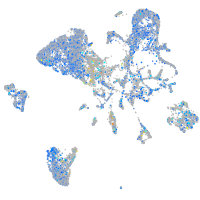
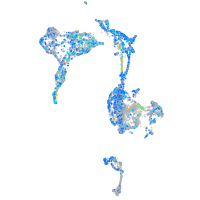
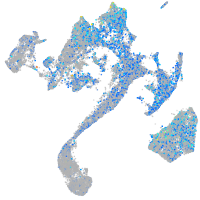
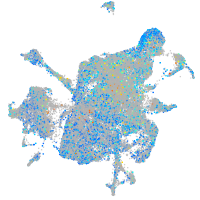
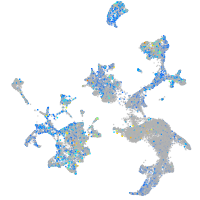
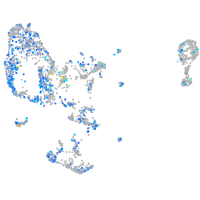
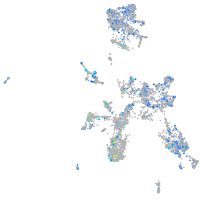
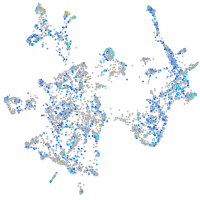
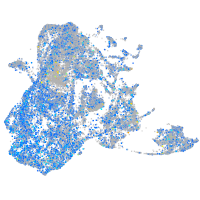
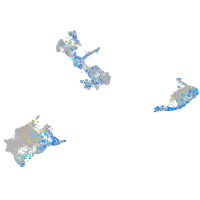
Gene expression UMAP
Display:
Expression
Stage
Other cell groups
all cells
blastomeres
PGCs
endoderm
axial mesoderm
muscle
mural cells /
non-skeletal muscle
mesenchyme
hematopoietic /
vasculature
pronephros
neural
spinal cord / glia
eye
taste / olfactory
otic / lateral line
epidermis
periderm
fin
ionocytes / mucous
pigment cells
Expression by stage/cluster
Correlated gene expression
Positive correlation
Negative correlation
Gene
r
Gene
r
ptprq
0.136
hbae1.1
-0.058
si:ch211-284k5.2
0.132
hbbe1.1
-0.051
inhbab
0.123
csdc2a
-0.050
syn3
0.111
actc1b
-0.049
espnla
0.109
stmn1a
-0.048
LOC110438806
0.108
mt-atp8
-0.047
kiaa1549lb
0.107
hs3st3b1a
-0.046
otofb
0.103
NC-002333.4
-0.045
coq2
0.103
zgc:165555.3
-0.045
CABZ01012885.1
0.103
foxg1a
-0.045
lrrc15
0.102
myhz2
-0.044
ecel1
0.101
ckmb
-0.044
si:dkey-172m14.2
0.100
LOC100534832
-0.042
b4galt2
0.098
pcgf6
-0.041
xbp1
0.098
zgc:158463
-0.040
copz2
0.097
wdr83
-0.040
LOC103910921
0.097
si:dkey-202b22.6
-0.039
LOC110437837
0.096
cenpx
-0.039
sdf2
0.096
LOC110439372
-0.038
CABZ01034691.1
0.091
plekhb2
-0.038
malt2
0.091
CU467822.1
-0.038
LOC103910253
0.090
rrm2
-0.037
gsr
0.089
pold1
-0.037
BX294444.1
0.089
si:dkey-7l6.3
-0.037
LOC103908679
0.089
cby1
-0.036
si:dkey-199f5.8
0.089
lig1
-0.036
tbx16
0.087
hey1
-0.036
LOC101885184
0.087
ppm1g
-0.036
tmed2
0.087
CABZ01044053.1
-0.036
edf1
0.086
pola2
-0.036
tanc2a
0.086
tnni2a.4
-0.036
twf2a
0.085
CR855277.2
-0.035
si:ch211-258f1.3
0.085
ruvbl2
-0.035
LO018188.1
0.084
rrp15
-0.035
LOC101885478
0.084
pola1
-0.035