Daniocell
git2a (mural cells / non-skeletal muscle)
G protein-coupled receptor kinase interacting ArfGAP 2a
ZFIN
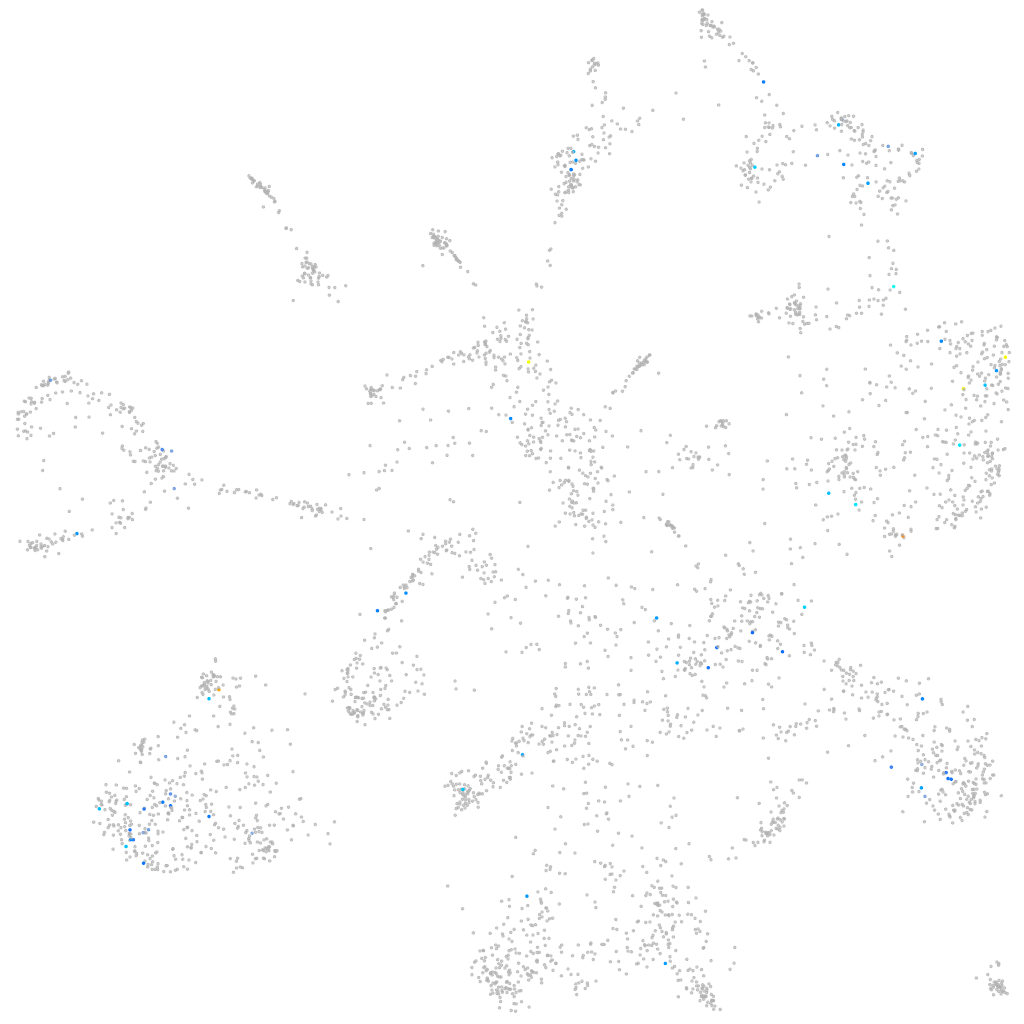
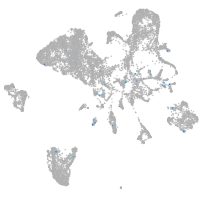
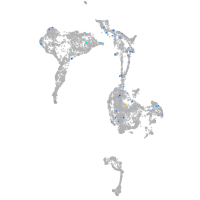
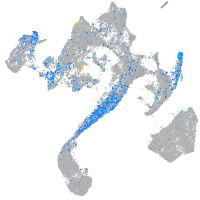
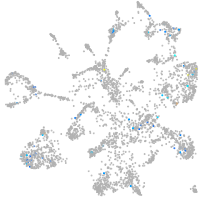
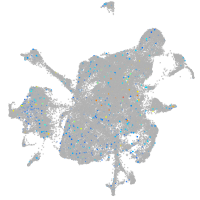
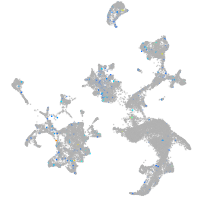
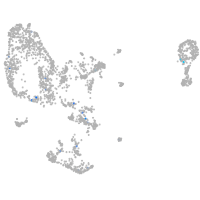
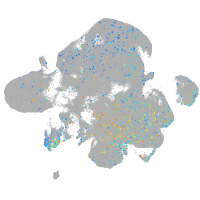
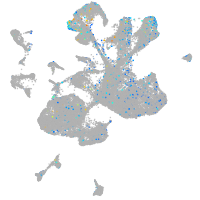
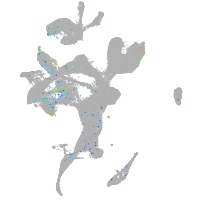
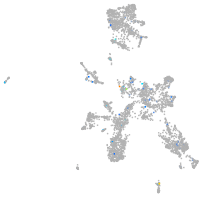
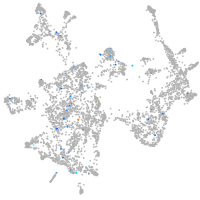
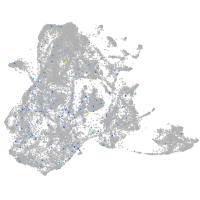
Gene expression UMAP
Display:
Expression
Stage
Other cell groups
all cells
blastomeres
PGCs
endoderm
axial mesoderm
muscle
mural cells /
non-skeletal muscle
mesenchyme
hematopoietic /
vasculature
pronephros
neural
spinal cord / glia
eye
taste / olfactory
otic / lateral line
epidermis
periderm
fin
ionocytes / mucous
pigment cells
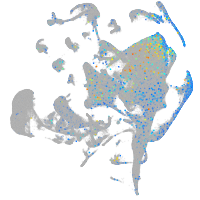
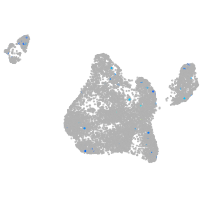
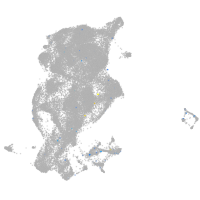
Expression by stage/cluster
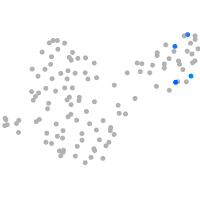
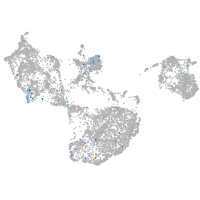
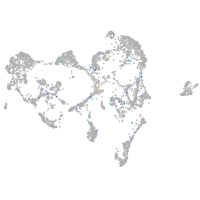
Correlated gene expression
Positive correlation
Negative correlation
Gene
r
Gene
r
XLOC-009562
0.288
tpm1
-0.059
ch25hl2
0.224
acta2
-0.056
znf1089
0.214
tagln
-0.056
XLOC-043659
0.186
myl9a
-0.050
smpd3
0.186
BX088707.3
-0.050
cbln9
0.170
sept10
-0.050
pcdh1g2
0.169
myh11a
-0.048
si:dkey-33c9.8
0.167
mylkb
-0.044
XLOC-000342
0.167
cox4i2
-0.044
hhipl1
0.165
myl6
-0.041
CR318673.1
0.164
pdgfrb
-0.040
LOC110438761
0.160
atp5f1e
-0.039
LOC108179143
0.158
csrp1b
-0.039
LOC101884392
0.154
myl9b
-0.039
LOC110438000
0.153
atp5mc3b
-0.036
chrnb2l
0.149
ak1
-0.036
si:ch73-299h12.2
0.149
zgc:153867
-0.035
LOC110438084
0.144
mcamb
-0.035
si:ch73-301j1.1
0.142
iscub
-0.035
AL772300.2
0.142
lama4
-0.034
LOC100536618
0.142
zgc:92630
-0.034
eif4e1b
0.141
lpp
-0.034
LOC101884251
0.141
si:ch211-137i24.10
-0.034
BX000522.1
0.140
angptl5
-0.033
CU207217.1
0.140
lmod1b
-0.033
XLOC-043390
0.140
ckba
-0.033
CR388190.1
0.139
tpm2
-0.033
sst2
0.139
rpl27
-0.033
cnga3a
0.139
mcu
-0.033
LOC101886530
0.137
anxa4
-0.033
fbxw10
0.134
cox6a1
-0.033
XLOC-013339
0.134
gngt2b
-0.032
si:ch211-27e6.1
0.133
socs3a
-0.032
si:ch211-125m10.6
0.128
cald1b
-0.032
znf970
0.127
cnn1b
-0.032