Daniocell
gfpt1 (glial cells / spinal cord)
glutamine--fructose-6-phosphate transaminase 1
ZFIN
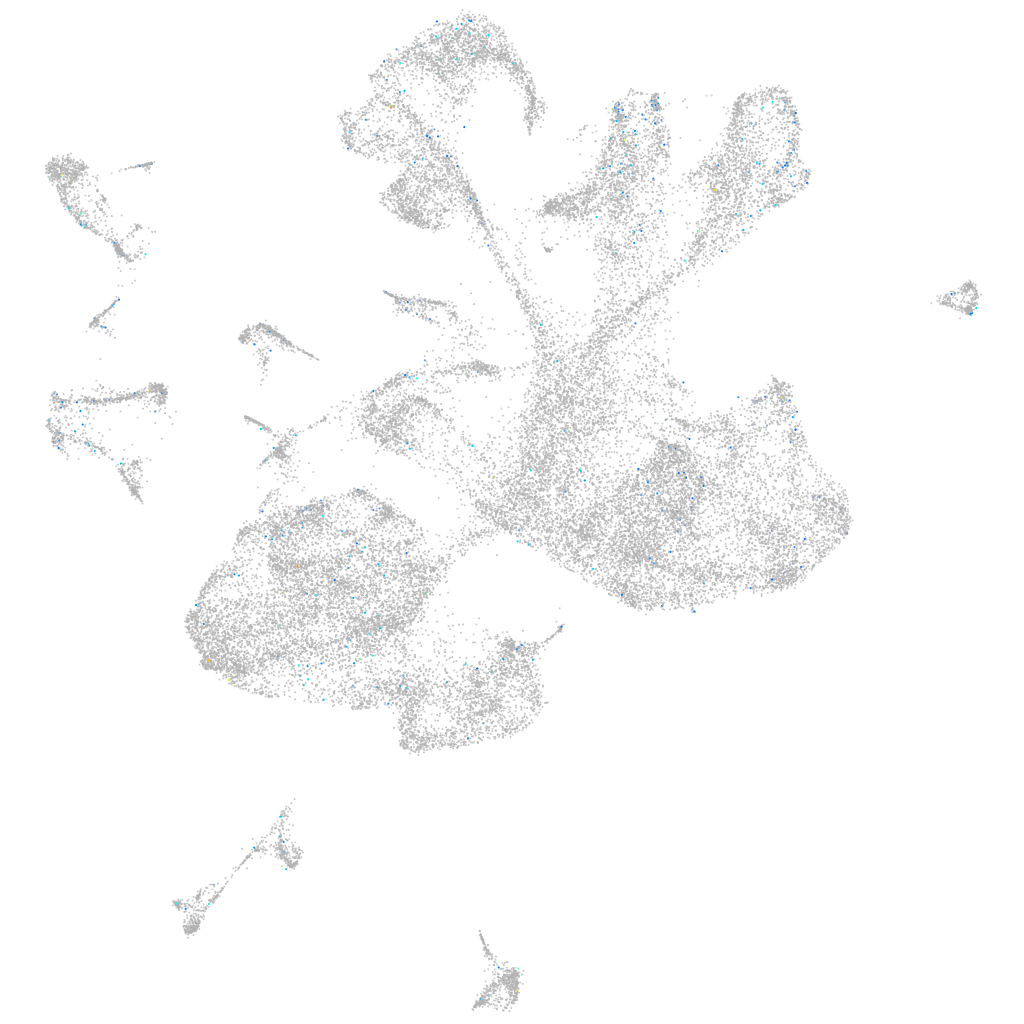
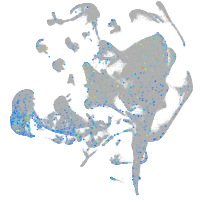
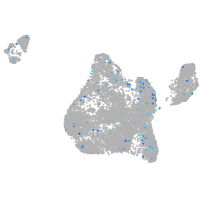
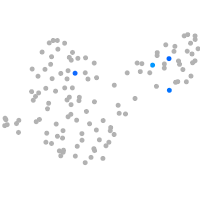
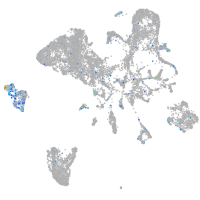
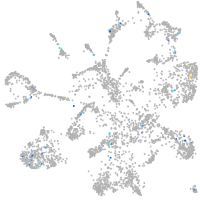
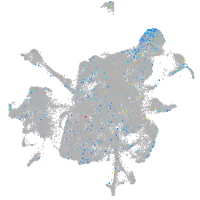
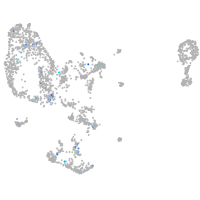
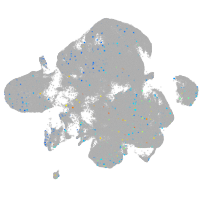
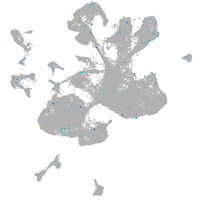
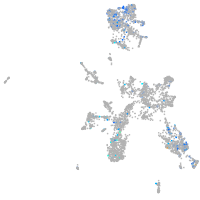
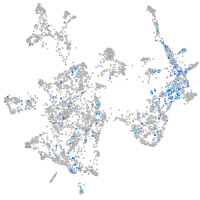
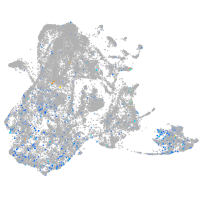
Gene expression UMAP
Display:
Expression
Stage
Other cell groups
all cells
blastomeres
PGCs
endoderm
axial mesoderm
muscle
mural cells /
non-skeletal muscle
mesenchyme
hematopoietic /
vasculature
pronephros
neural
spinal cord / glia
eye
taste / olfactory
otic / lateral line
epidermis
periderm
fin
ionocytes / mucous
pigment cells
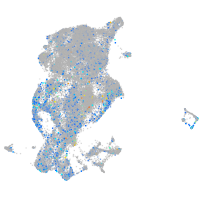
Expression by stage/cluster
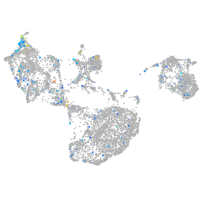
Correlated gene expression
Positive correlation
Negative correlation
Gene
r
Gene
r
FP015862.1
0.101
XLOC-003692
-0.031
taar19c
0.101
her15.1
-0.030
taar19e
0.101
abhd6a
-0.030
CR339041.2
0.098
XLOC-003689
-0.030
LOC110437898
0.092
mdka
-0.028
CU638702.1
0.083
si:dkey-42i9.4
-0.027
LOC103911713
0.081
XLOC-003690
-0.027
LOC108191530
0.081
her4.2
-0.026
LOC101883803
0.077
dla
-0.026
LOC100148951
0.077
her4.1
-0.025
CR376740.1
0.075
hmgb2a
-0.025
pimr133
0.074
stmn1a
-0.025
sc:d0284
0.074
notch1a
-0.025
LOC108191717
0.070
hmgb2b
-0.025
LOC101883382
0.069
sox3
-0.023
BX927377.1
0.064
gadd45gb.1
-0.022
si:ch211-272h9.3
0.062
her4.4
-0.022
LOC103910744.1
0.060
her12
-0.022
RF00593
0.057
si:ch73-21g5.7
-0.021
RF00068
0.056
si:dkey-151g10.6
-0.021
si:dkey-261o4.8
0.056
sox19a
-0.021
LOC108179161
0.053
notch1b
-0.021
LOC110438279
0.050
mir219-3
-0.021
CR354581.1
0.049
LOC798783
-0.021
FP340271.1
0.048
neurog1
-0.020
si:ch211-45c16.2
0.048
dut
-0.020
rtn1b
0.048
cx43.4
-0.020
si:dkey-23o4.6
0.047
cdca7a
-0.020
rasal1a
0.047
mcm7
-0.020
BX323837.1
0.047
foxb1a
-0.020
si:dkey-58f10.13
0.047
sox19b
-0.019
LOC100534771
0.047
neurod4
-0.019
ndp
0.047
gmnn
-0.019
atl1
0.046
irx3b
-0.019
CU657976.1
0.046
ccnd1
-0.019