Daniocell
gcnt4a (epidermis)
glucosaminyl (N-acetyl) transferase 4a
ZFIN
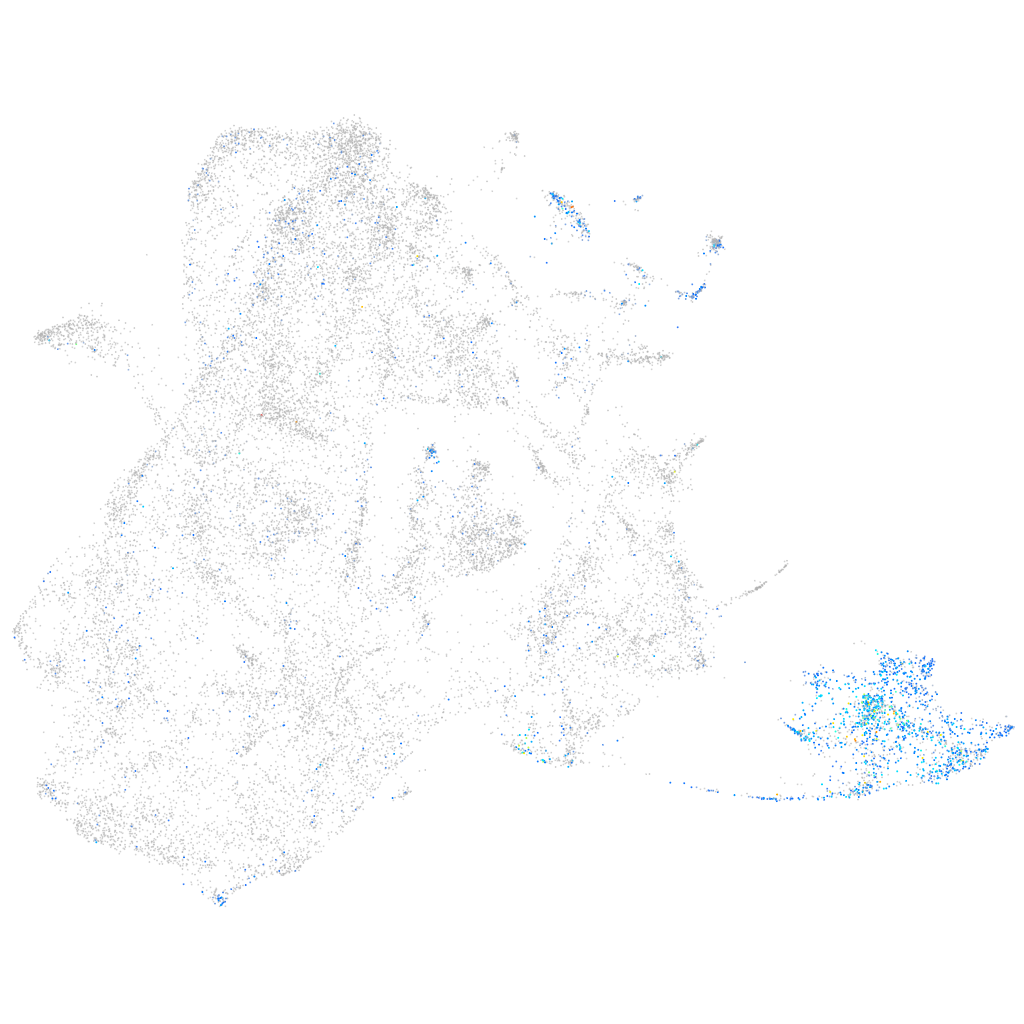
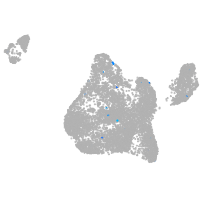
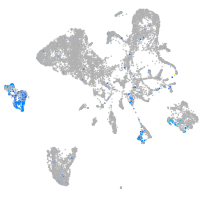
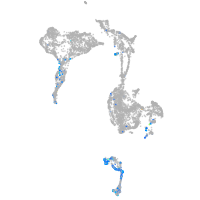
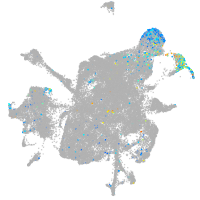
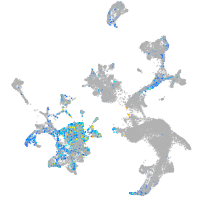
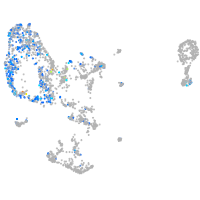
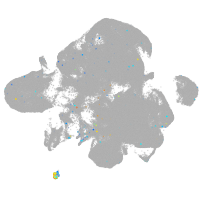
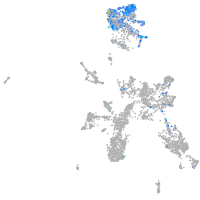
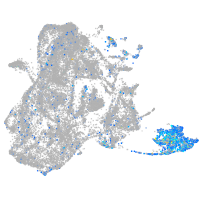
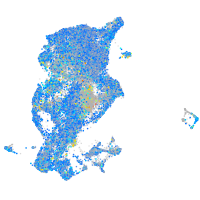
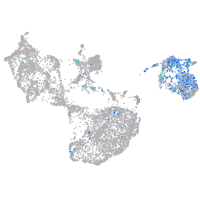
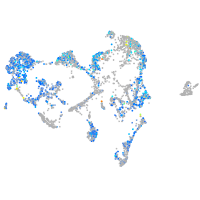
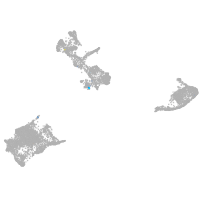
Gene expression UMAP
Display:
Expression
Stage
Other cell groups
all cells
blastomeres
PGCs
endoderm
axial mesoderm
muscle
mural cells /
non-skeletal muscle
mesenchyme
hematopoietic /
vasculature
pronephros
neural
spinal cord / glia
eye
taste / olfactory
otic / lateral line
epidermis
periderm
fin
ionocytes / mucous
pigment cells
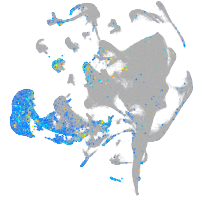
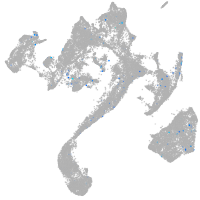
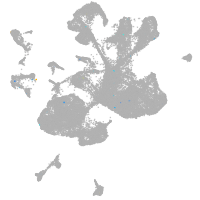
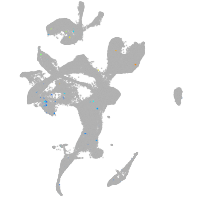
Expression by stage/cluster
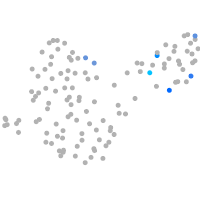
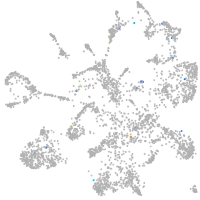
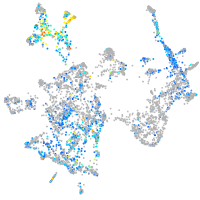
Correlated gene expression
Positive correlation
Negative correlation
Gene
r
Gene
r
si:ch211-157c3.4
0.588
tmsb4x
-0.325
zgc:153665
0.582
cldni
-0.247
si:ch73-204p21.2
0.581
sparc
-0.229
scel
0.580
cldn1
-0.225
evplb
0.567
pfn1
-0.209
lye
0.565
col1a2
-0.203
dhrs13a.2
0.563
ecrg4b
-0.197
stard14
0.557
pak2a
-0.194
krt1-19d
0.553
ptmaa
-0.193
ponzr5
0.551
col11a1a
-0.186
cldn23a
0.550
si:dkey-16p21.8
-0.186
hsd17b12a
0.547
si:ch211-222l21.1
-0.185
agr1
0.545
tp63
-0.184
cldne
0.543
col2a1b
-0.182
ppl
0.543
myh9a
-0.179
anxa1b
0.540
spaca4l
-0.178
stx11b.1
0.537
actb1
-0.176
anxa1c
0.535
col18a1a
-0.169
si:ch211-195b11.3
0.533
cotl1
-0.169
si:dkey-87o1.2
0.531
vdac3
-0.169
zgc:165423
0.530
col1a1b
-0.168
evpla
0.529
zgc:86896
-0.167
si:ch73-347e22.8
0.527
col1a1a
-0.166
si:cabz01007794.1
0.521
postnb
-0.165
zgc:193505
0.516
flna
-0.161
ANXA1 (1 of many)
0.515
krt5
-0.151
tmem45b
0.510
zgc:101810
-0.151
capn9
0.510
actb2
-0.150
selenow2b
0.507
mdka
-0.148
si:ch211-125o16.4
0.506
id1
-0.148
si:ch73-52f15.5
0.505
ptmab
-0.147
gbgt1l4
0.504
tagln2
-0.146
plekhf1
0.503
fkbp7
-0.143
XLOC-027129
0.498
dcn
-0.142
nqo1
0.492
thy1
-0.140