Daniocell
gbe1b (hematopoietic / vasculature)
"glucan (1,4-alpha-), branching enzyme 1b"
ZFIN
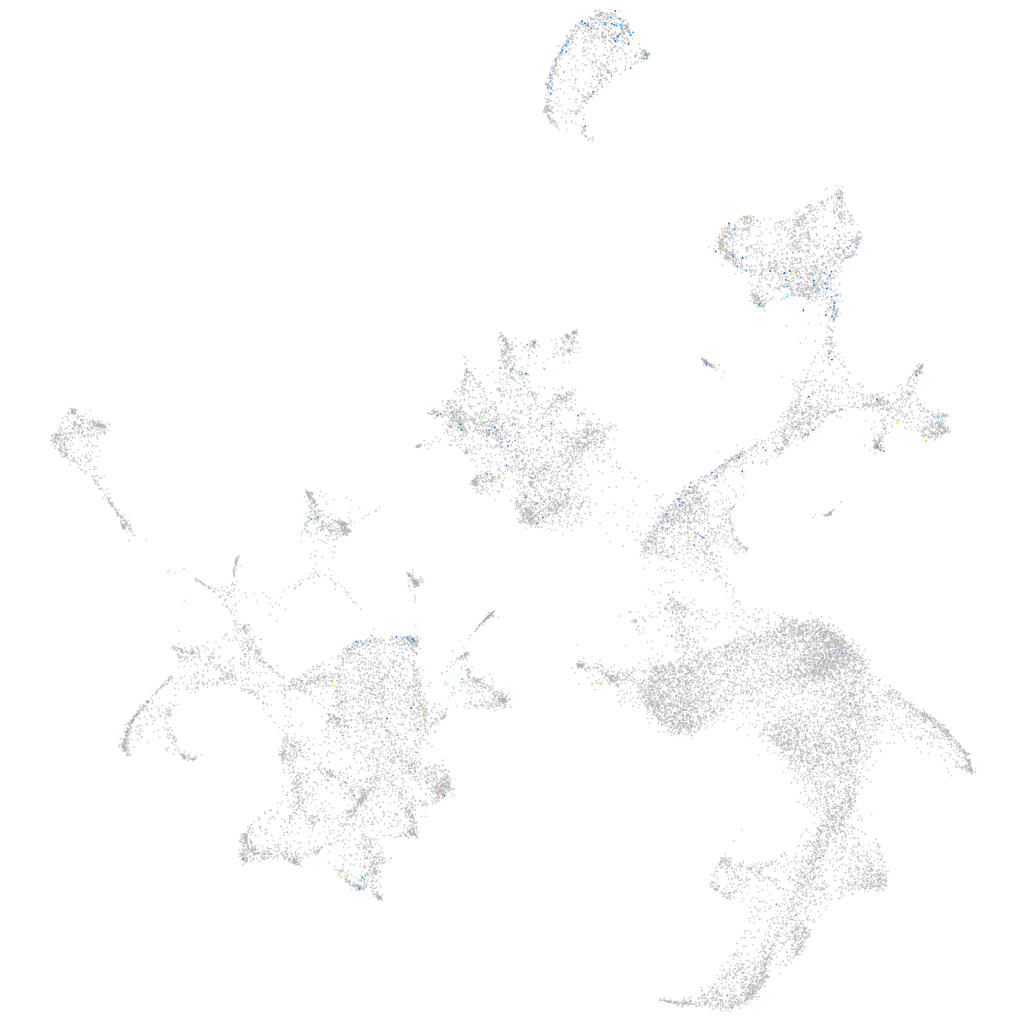
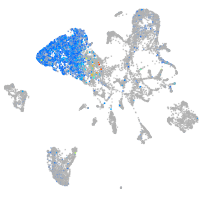
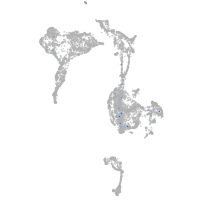
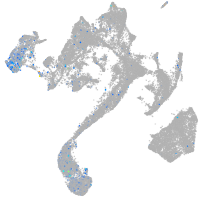
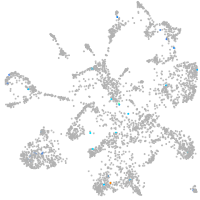
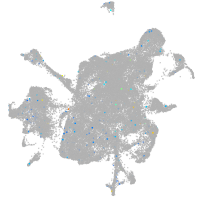
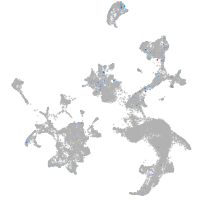
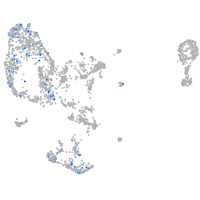
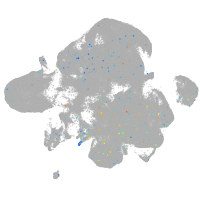
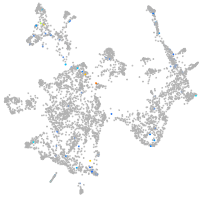
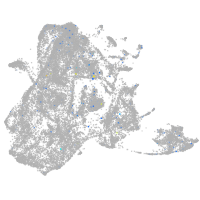
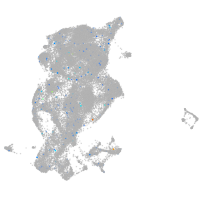
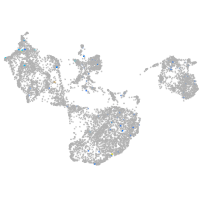
Gene expression UMAP
Display:
Expression
Stage
Other cell groups
all cells
blastomeres
PGCs
endoderm
axial mesoderm
muscle
mural cells /
non-skeletal muscle
mesenchyme
hematopoietic /
vasculature
pronephros
neural
spinal cord / glia
eye
taste / olfactory
otic / lateral line
epidermis
periderm
fin
ionocytes / mucous
pigment cells
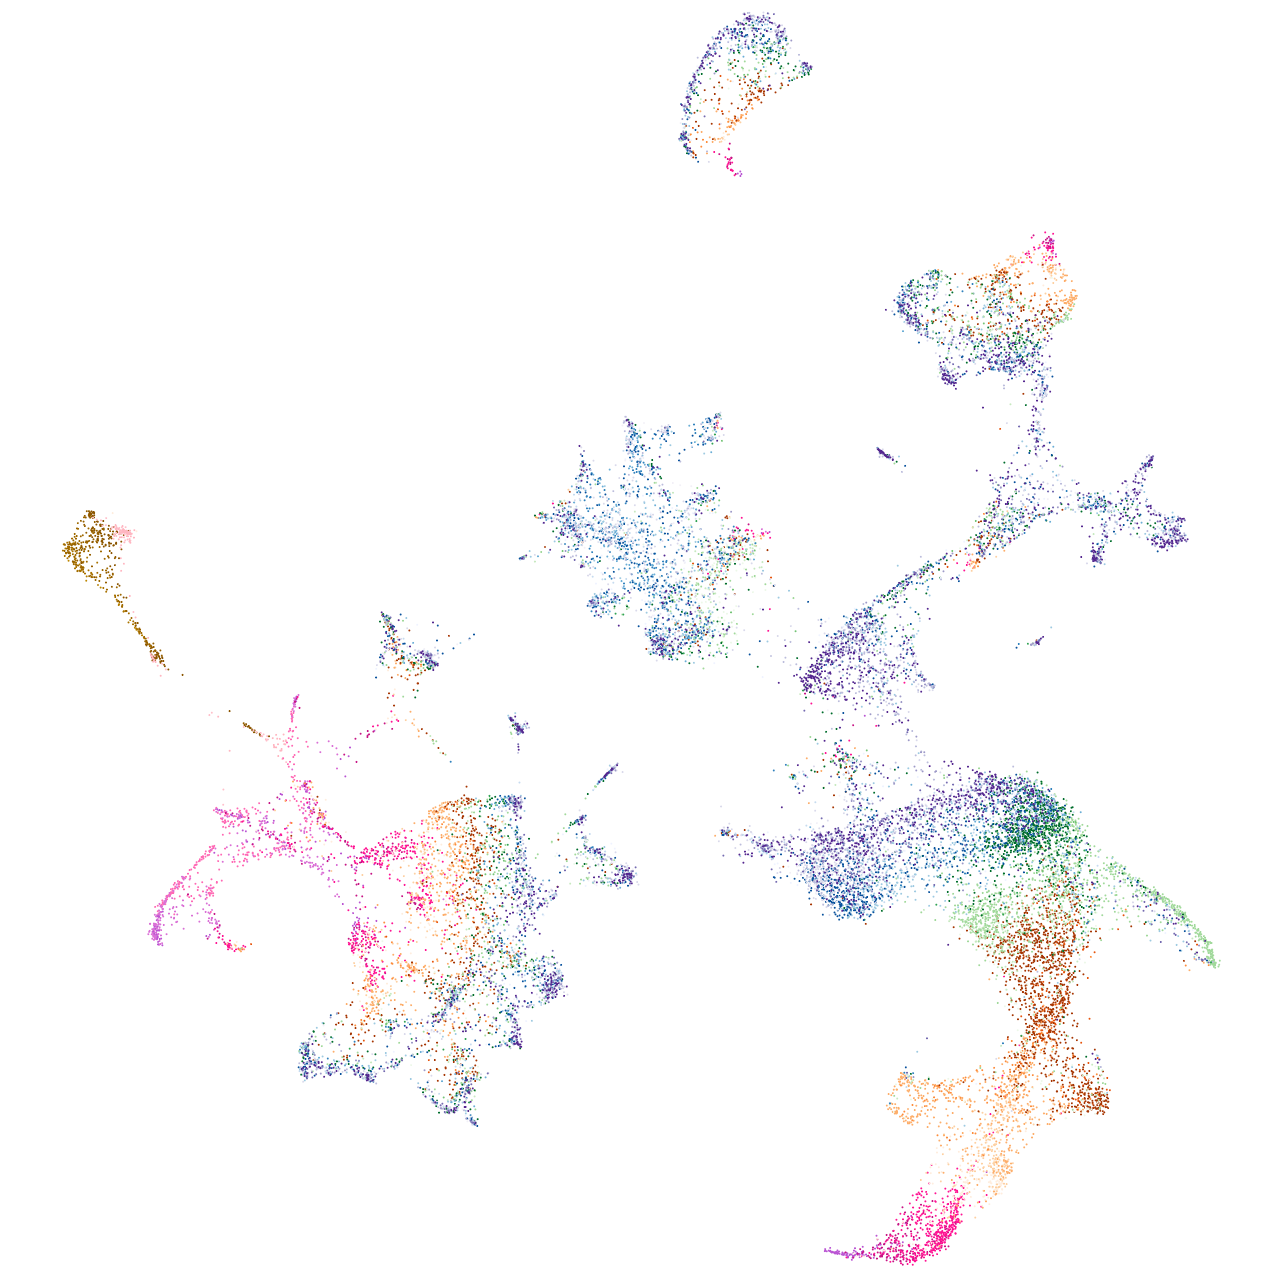
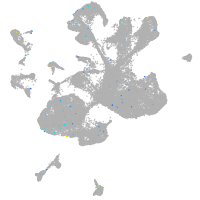
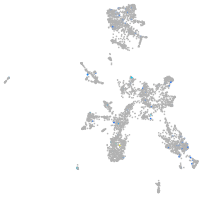
Expression by stage/cluster
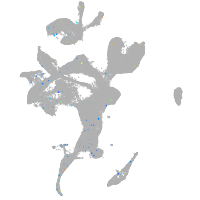
Correlated gene expression
Positive correlation
Negative correlation
Gene
r
Gene
r
LOC103909745
0.216
hbae1.3
-0.061
si:ch211-53m15.2
0.166
hbae3
-0.060
OSCP1 (1 of many)
0.141
hbae1.1
-0.060
mir183
0.133
hbbe1.3
-0.058
si:ch211-238e22.7
0.129
hbbe2
-0.057
znf972
0.122
alas2
-0.056
BX571954.1
0.116
hbbe1.1
-0.056
taar18d
0.106
hemgn
-0.054
LOC108190132
0.104
cahz
-0.051
si:ch211-283g2.1
0.104
slc4a1a
-0.050
cdx1b
0.103
hbbe1.2
-0.049
matk
0.100
zgc:163057
-0.049
XLOC-015449
0.100
epb41b
-0.048
si:ch211-284o19.8
0.097
fth1a
-0.048
nr5a1b
0.096
nt5c2l1
-0.047
LOC101887064
0.096
blvrb
-0.045
spice1
0.095
tspo
-0.043
CU929402.1
0.094
si:ch211-250g4.3
-0.041
LOC110437769
0.093
hbbe3
-0.041
laptm5
0.093
zgc:56095
-0.040
taar20z
0.093
prdx2
-0.040
cebpb
0.092
si:ch211-207c6.2
-0.039
rac2
0.091
tmod4
-0.038
spi1b
0.091
hbae5
-0.038
LOC103911496
0.089
plac8l1
-0.038
cyba
0.089
uros
-0.036
il1b
0.088
creg1
-0.036
best1
0.088
rfesd
-0.036
si:dkey-205i10.2
0.086
nmt1b
-0.036
CT867973.2
0.085
ucp3
-0.035
dgat1a
0.084
si:ch211-227m13.1
-0.035
wasa
0.083
aqp1a.1
-0.034
fcer1gl
0.083
TCIM (1 of many)
-0.032
arpc1b
0.083
glrx5
-0.032
ctss2.1
0.083
clgn
-0.032