Daniocell
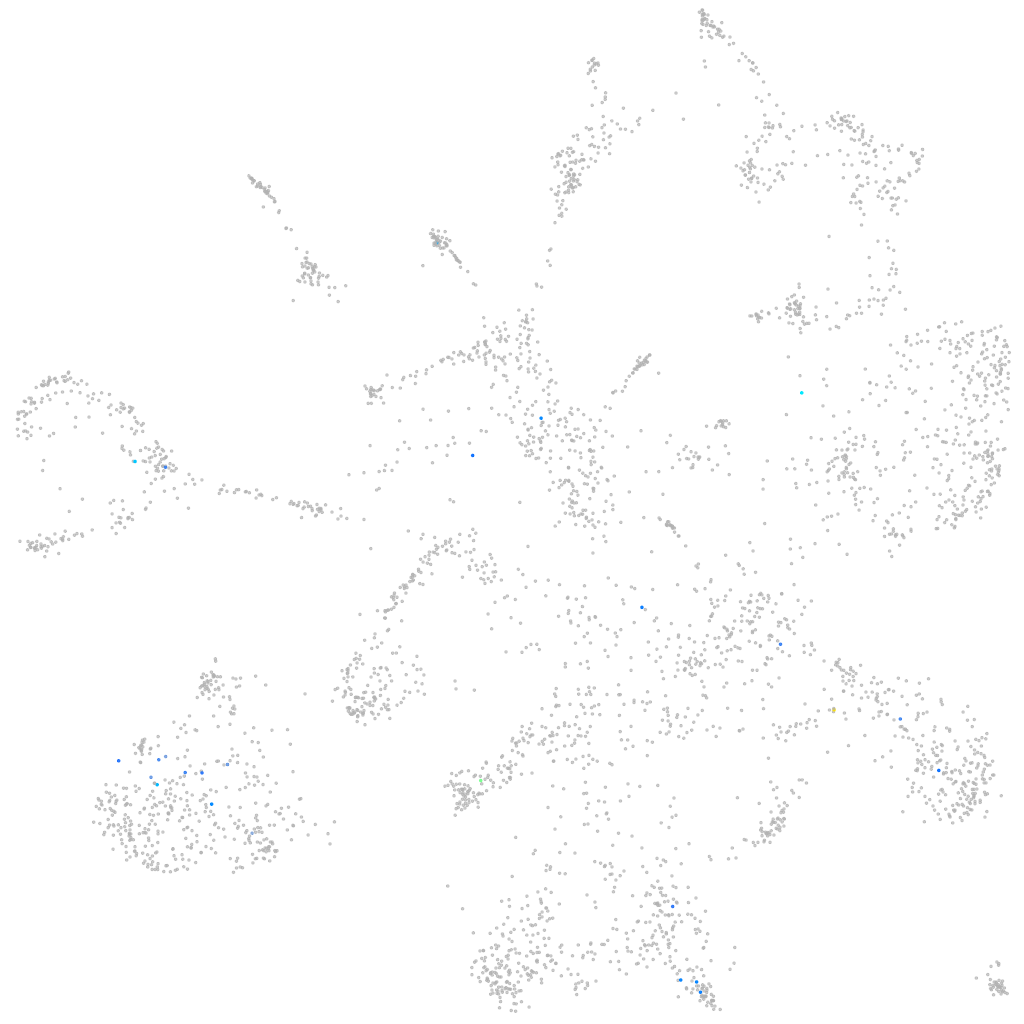
galnt13 (mural cells / non-skeletal muscle)
UDP-N-acetyl-alpha-D-galactosamine:polypeptide N-acetylgalactosaminyltransferase 13
ZFIN
Gene expression UMAP
Display:
Expression
Stage
Other cell groups
all cells
blastomeres
PGCs
endoderm
axial mesoderm
muscle
mural cells /
non-skeletal muscle
mesenchyme
hematopoietic /
vasculature
pronephros
neural
spinal cord / glia
eye
taste / olfactory
otic / lateral line
epidermis
periderm
fin
ionocytes / mucous
pigment cells
Expression by stage/cluster
Correlated gene expression
Positive correlation
Negative correlation
Gene
r
Gene
r
LOC101886839
0.456
sparc
-0.057
LOC110440053
0.368
tmsb4x
-0.041
LOC103909000
0.326
ctsla
-0.039
asb4
0.304
tmem176
-0.037
si:dkey-108k21.28
0.284
tspan4a
-0.036
CU459093.1
0.251
si:dkey-261h17.1
-0.033
XLOC-008804
0.246
serinc2
-0.033
six7
0.238
tspan36
-0.032
CU633486.1
0.233
tmem98
-0.032
si:dkey-23a13.8
0.219
tmem88b
-0.031
echdc1
0.215
bambia
-0.031
tmem250
0.215
pvalb2
-0.031
BX470246.1
0.212
anxa3b
-0.031
nsmfa
0.200
col12a1a
-0.031
si:ch211-175f12.2
0.196
itm2ba
-0.031
CT027674.1
0.195
selenow1
-0.030
XLOC-013106
0.192
krt94
-0.030
guk1b
0.188
si:ch1073-291c23.2
-0.030
BX004816.1
0.186
eef1a1l1
-0.030
BX908780.1
0.186
zfp36l1a
-0.030
cyth3b
0.183
itga1
-0.030
pfklb
0.182
sept10
-0.030
XLOC-002533
0.180
si:ch211-286o17.1
-0.029
XLOC-015075
0.178
tspan18b
-0.029
LOC100329358
0.177
flot1b
-0.029
zgc:153441
0.175
zfp36l1b
-0.029
parp12a
0.174
mylz3
-0.029
STX3
0.173
adamts15a
-0.029
rdh8b
0.173
fermt2
-0.029
scamp5b
0.172
si:dkeyp-113d7.1
-0.029
pmch
0.166
si:ch211-286b5.5
-0.028
mia
0.164
lurap1
-0.028
si:dkey-77f5.11
0.164
pmp22b
-0.028
dclk2b
0.161
emd
-0.028
kif25
0.159
anxa1a
-0.028