Daniocell
g6pd (glial cells / spinal cord)
glucose-6-phosphate dehydrogenase
ZFIN
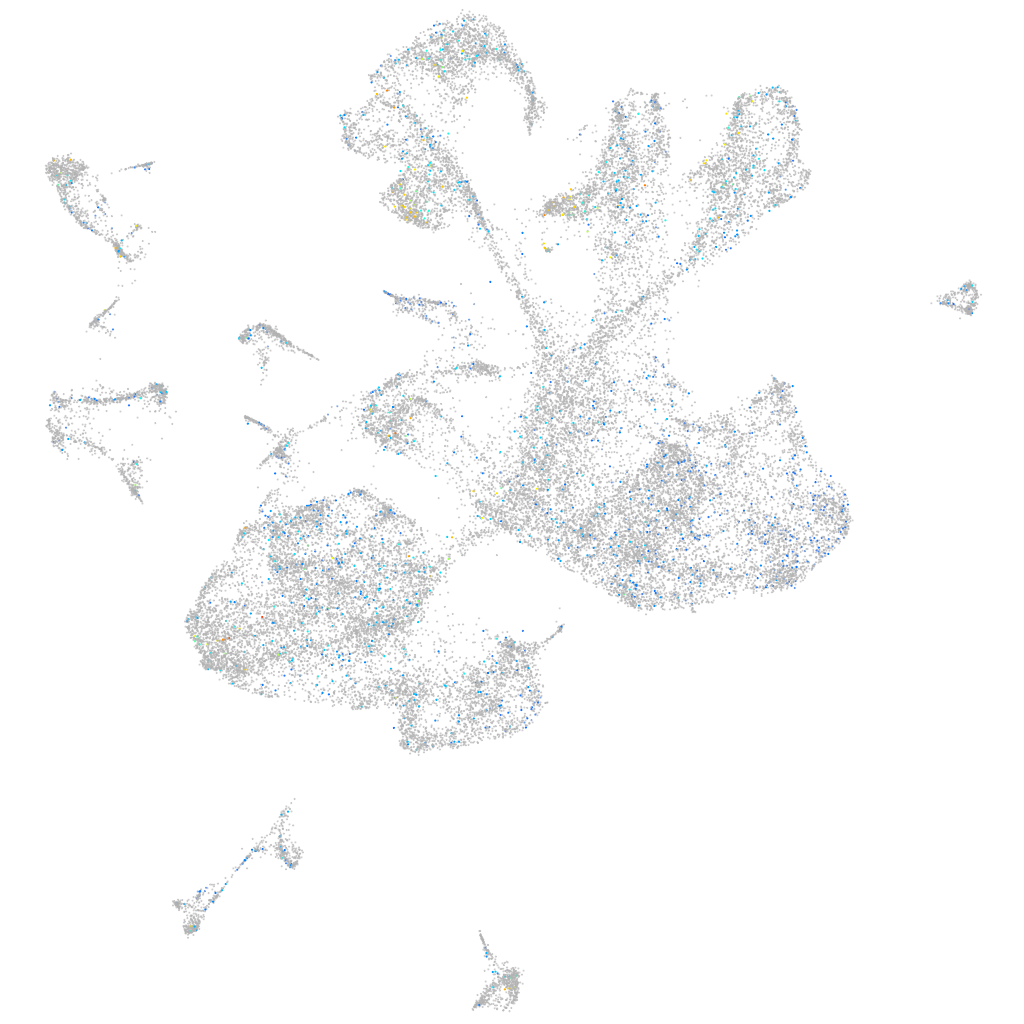
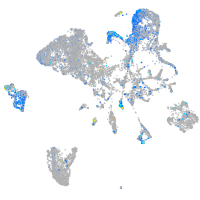
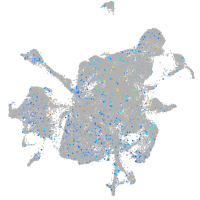
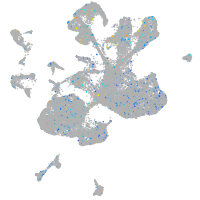
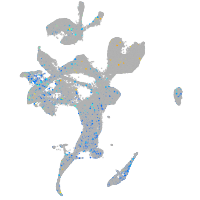
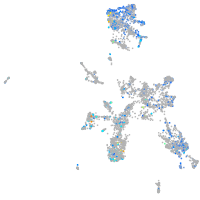
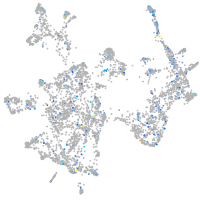
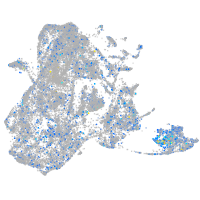
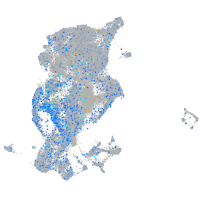
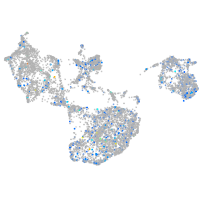
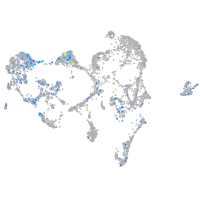
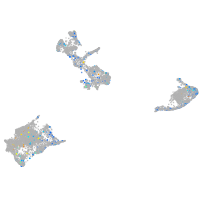
Gene expression UMAP
Display:
Expression
Stage
Other cell groups
all cells
blastomeres
PGCs
endoderm
axial mesoderm
muscle
mural cells /
non-skeletal muscle
mesenchyme
hematopoietic /
vasculature
pronephros
neural
spinal cord / glia
eye
taste / olfactory
otic / lateral line
epidermis
periderm
fin
ionocytes / mucous
pigment cells
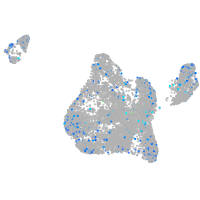
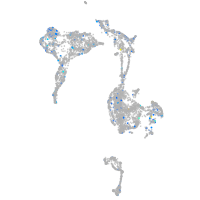
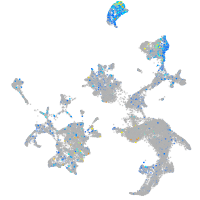
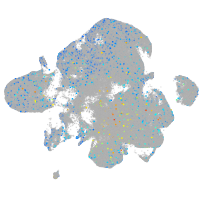
Expression by stage/cluster
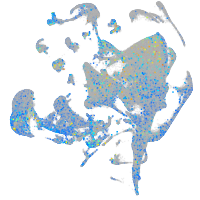
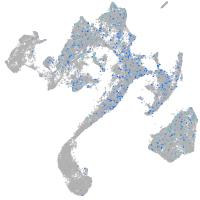
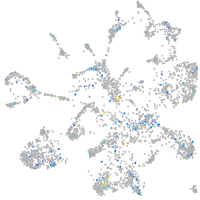
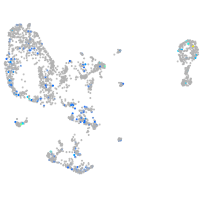
Correlated gene expression
Positive correlation
Negative correlation
Gene
r
Gene
r
LOC103910818
0.064
rpl37
-0.025
LO017849.1
0.060
rps28
-0.025
or104-1
0.052
fstl1a
-0.025
LOC101884125
0.049
hmgb2a
-0.024
LOC103910812
0.045
rplp2l
-0.024
taar20z
0.045
si:dkey-151g10.6
-0.024
si:dkey-23c22.7
0.044
rplp1
-0.023
clic5a
0.043
rhbdl3
-0.023
si:dkey-28d5.14
0.043
dlb
-0.023
ghsra
0.042
XLOC-003690
-0.023
trhrb
0.041
si:ch211-57n23.4
-0.023
arhgef15
0.041
cep131
-0.022
jac3
0.040
XLOC-003689
-0.022
mapk8ip2
0.040
rps29
-0.022
LOC108183475
0.040
rpl39
-0.022
sox4a
0.039
rpl29
-0.021
grm5a
0.039
rpl21
-0.021
si:ch73-380l3.4
0.039
rpl24
-0.021
si:dkey-56f14.7
0.039
rps20
-0.020
nanos1
0.038
her15.1
-0.020
CT030048.1
0.038
rps24
-0.020
trpc4b
0.038
si:ch73-21g5.7
-0.019
sprn
0.037
cldn5a
-0.019
zgc:194330
0.037
vim
-0.019
XLOC-043106
0.037
slc1a3a
-0.019
ccsapa
0.036
XLOC-003692
-0.019
si:dkey-29j8.3
0.036
rps7
-0.019
CU207343.2
0.036
her13
-0.019
si:ch211-209a2.2
0.036
notch1a
-0.019
ndrg4
0.036
rpl23
-0.018
scgn
0.036
lfng
-0.018
mir2193.1
0.035
rps19
-0.018
smarcc2
0.035
hmgb2b
-0.018
tmsb2
0.035
LOC798783
-0.018
wu:fi75a02
0.035
rps21
-0.018