Daniocell
fuz (glial cells / spinal cord)
fuzzy planar cell polarity protein
ZFIN
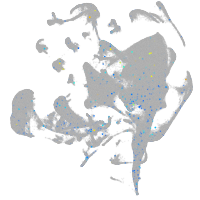
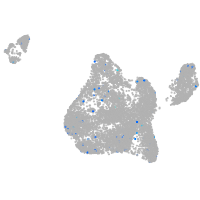
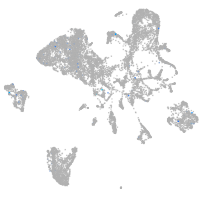
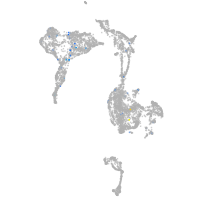
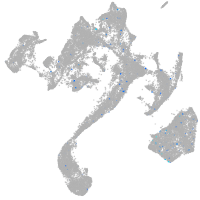
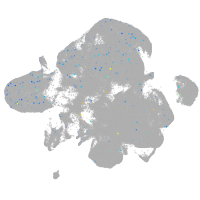
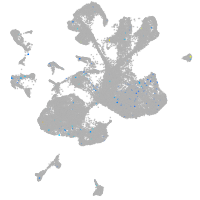
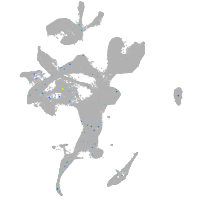
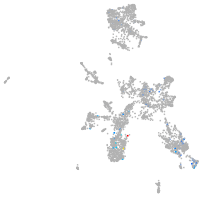
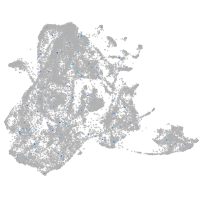
Gene expression UMAP
Display:
Expression
Stage
Other cell groups
all cells
blastomeres
PGCs
endoderm
axial mesoderm
muscle
mural cells /
non-skeletal muscle
mesenchyme
hematopoietic /
vasculature
pronephros
neural
spinal cord / glia
eye
taste / olfactory
otic / lateral line
epidermis
periderm
fin
ionocytes / mucous
pigment cells
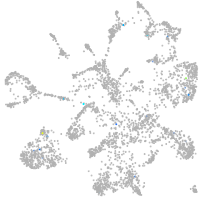
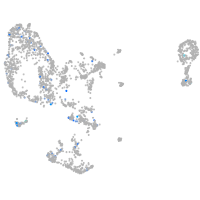
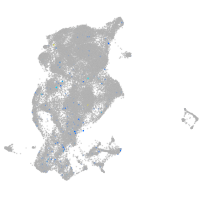
Expression by stage/cluster
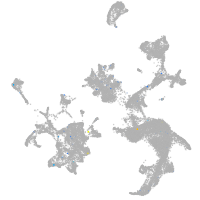
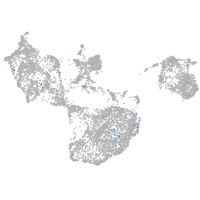
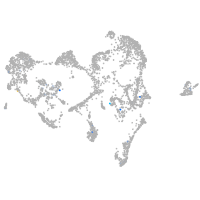
Correlated gene expression
Positive correlation
Negative correlation
Gene
r
Gene
r
LOC108191357
0.113
fabp3
-0.031
LOC108180164
0.098
myt1b
-0.029
LOC103909395
0.090
elavl3
-0.028
BX640512.3
0.084
tmsb
-0.026
BX322587.1
0.074
sncb
-0.026
BX927369.1
0.073
jpt1b
-0.025
sod3a
0.066
ube2ql1
-0.025
CABZ01066727.1
0.066
stmn1b
-0.025
CU062645.1
0.063
hmgb3a
-0.025
BX323458.2
0.063
gap43
-0.022
si:ch73-343g19.4
0.062
onecut1
-0.022
LOC101882250
0.062
cirbpb
-0.022
CABZ01090041.1
0.061
nhlh2
-0.022
CR936977.1
0.059
zc4h2
-0.022
ovch2
0.059
nsg2
-0.022
jac1
0.059
pacsin1b
-0.021
CT027772.1
0.057
pop7
-0.021
smkr1
0.056
hnrnpaba
-0.021
si:ch73-40a17.3
0.055
rbfox1
-0.021
CU928069.1
0.054
nova1
-0.021
foxj1a
0.054
rtn1a
-0.021
XLOC-016403
0.051
fscn1a
-0.021
CR759826.1
0.051
dpysl3
-0.021
ccdc173
0.051
scrt2
-0.021
XLOC-028243
0.051
lcor
-0.021
CCR8 (1 of many)
0.050
insm1a
-0.021
adgrd2
0.050
dnaja2b
-0.021
taar18a
0.049
dlb
-0.021
tex9
0.049
tubb5
-0.020
zgc:55461
0.049
thsd7aa
-0.020
BX546453.2
0.048
myt1a
-0.020
btr18.1
0.048
cnrip1a
-0.020
CR354383.1
0.047
LOC100537384
-0.020
tlr4al
0.047
aplp1
-0.020
tnfrsf18
0.047
tmsb4x
-0.020