Daniocell
fosaa (muscle)
v-fos FBJ murine osteosarcoma viral oncogene homolog Aa
ZFIN
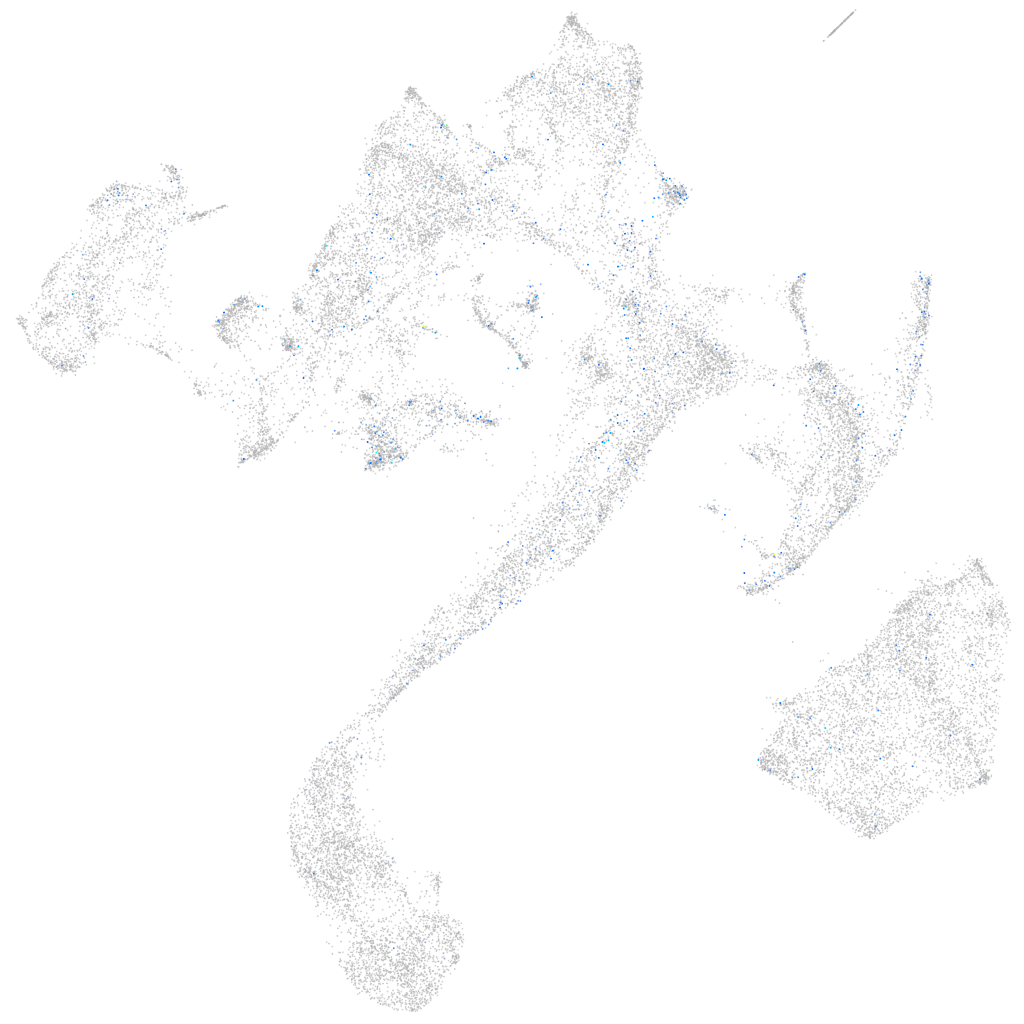
Gene expression UMAP
Display:
Expression
Stage
Other cell groups
all cells
blastomeres
PGCs
endoderm
axial mesoderm
muscle
mural cells /
non-skeletal muscle
mesenchyme
hematopoietic /
vasculature
pronephros
neural
spinal cord / glia
eye
taste / olfactory
otic / lateral line
epidermis
periderm
fin
ionocytes / mucous
pigment cells
Expression by stage/cluster
Correlated gene expression
Positive correlation
Negative correlation
Gene
r
Gene
r
LOC100002327
0.129
tnni2a.4
-0.039
CU652528.1
0.123
si:ch211-255p10.3
-0.039
CABZ01059408.1
0.118
tnnt3b
-0.039
LOC100537538
0.116
si:dkey-16p21.8
-0.039
atf3
0.114
pkmb
-0.038
junba
0.109
pvalb1
-0.038
XLOC-044191
0.108
pvalb2
-0.038
fosab
0.105
CABZ01061524.1
-0.037
si:ch73-335l21.4
0.097
mylpfb
-0.037
b3gat2
0.095
ryr3
-0.037
btg2
0.094
si:ch73-367p23.2
-0.037
jdp2b
0.093
prx
-0.036
mast1a
0.092
casq1a
-0.036
brinp3b
0.089
casq1b
-0.036
zgc:136872
0.086
ampd1
-0.036
fosl1a
0.083
slc25a4
-0.036
prkcab
0.083
eef2l2
-0.036
egr4
0.082
ank1a
-0.036
mb21d2
0.082
myom2a
-0.036
ier2b
0.080
pfkma
-0.035
tmem266
0.078
adssl1
-0.035
angptl4
0.078
si:ch73-366l1.5
-0.035
mansc1
0.078
dhrs7cb
-0.035
SLC29A4 (1 of many)
0.078
nme2b.2
-0.035
LOC103910383
0.076
atp2a1l
-0.035
txnipa
0.076
XLOC-025819
-0.035
CEP170B (1 of many)
0.076
gapdh
-0.034
fxyd6
0.074
ckma
-0.034
LOC103910497
0.073
tnnt3a
-0.034
gadd45ba
0.073
mylz3
-0.034
zgc:163061
0.073
atp2a1
-0.034
syngr3b
0.073
si:ch211-152c2.3
-0.034
BX537310.1
0.072
myom1a
-0.033
CU855917.1
0.072
XLOC-005350
-0.033
si:dkeyp-104b3.18
0.072
XLOC-006515
-0.033