Daniocell
fkbp10a (neural)
FKBP prolyl isomerase 10a
ZFIN
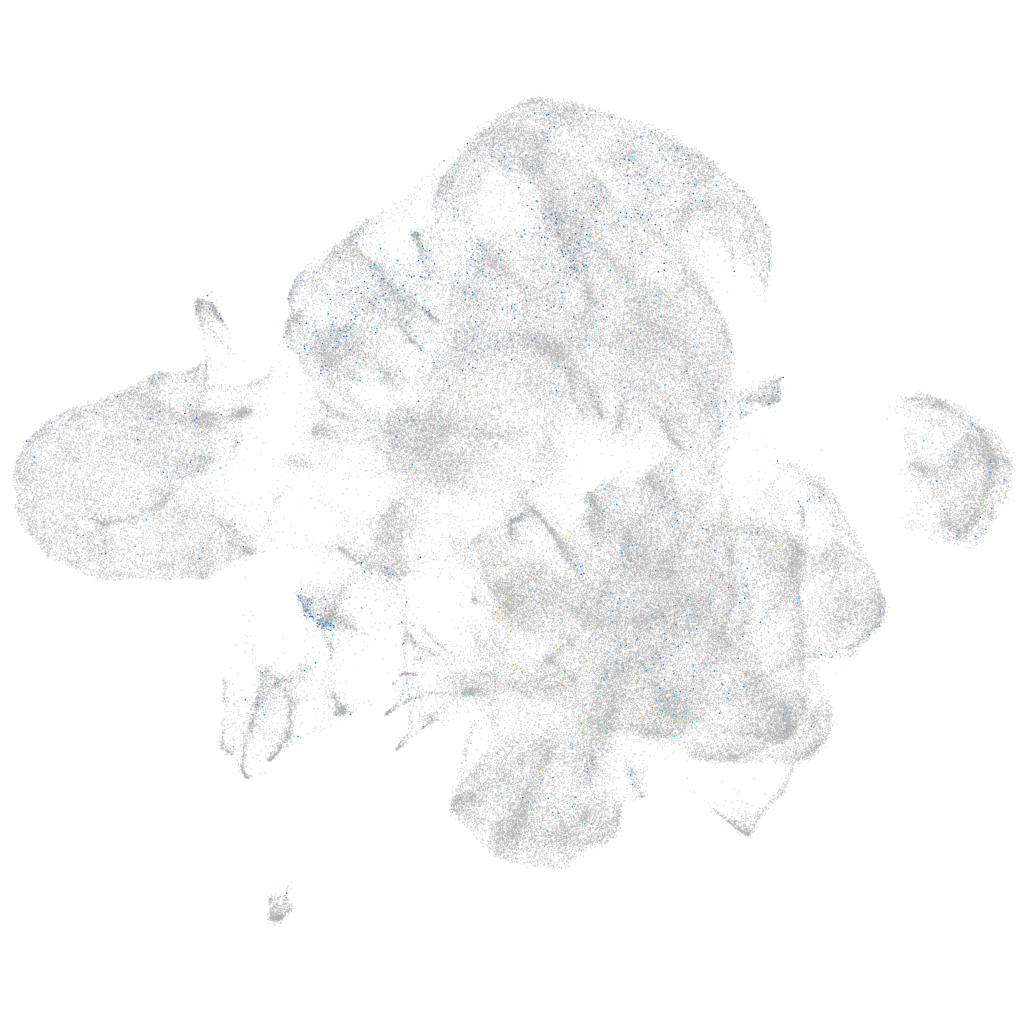
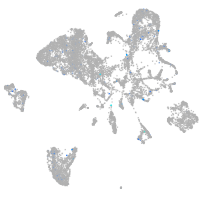
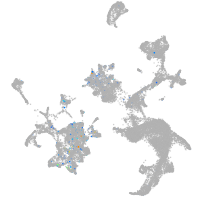
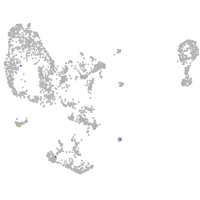
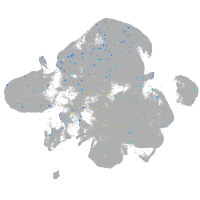
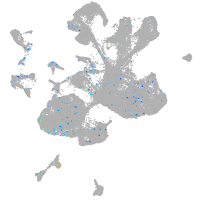
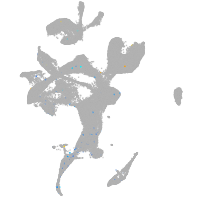
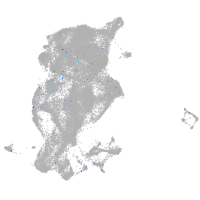
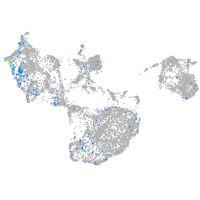
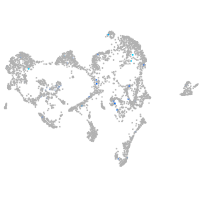
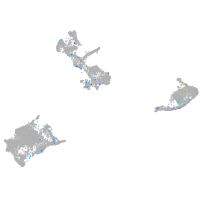
Gene expression UMAP
Display:
Expression
Stage
Other cell groups
all cells
blastomeres
PGCs
endoderm
axial mesoderm
muscle
mural cells /
non-skeletal muscle
mesenchyme
hematopoietic /
vasculature
pronephros
neural
spinal cord / glia
eye
taste / olfactory
otic / lateral line
epidermis
periderm
fin
ionocytes / mucous
pigment cells
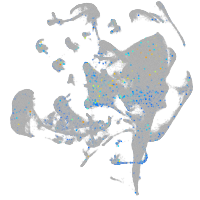
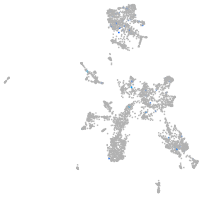
Expression by stage/cluster
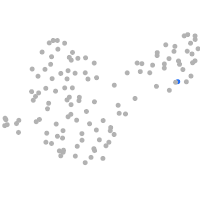
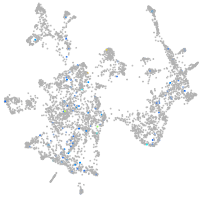
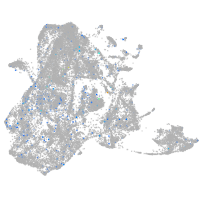
Correlated gene expression
Positive correlation
Negative correlation
Gene
r
Gene
r
LOC110438534
0.103
si:ch211-222l21.1
-0.021
LOC110439436
0.095
h3f3d
-0.020
LOC108181606
0.058
hmgn6
-0.019
LOC110437787
0.058
khdrbs1a
-0.019
CR388164.1
0.052
ptmab
-0.018
LOC108183454
0.051
hnrnpa1a
-0.017
zgc:171887
0.049
rps28
-0.017
LOC110439826
0.046
eef1a1l1
-0.016
BX927244.2
0.045
hnrnpa0b
-0.016
CABZ01056054.1
0.041
apoeb
-0.016
kitlgb
0.038
rpl29
-0.016
XLOC-043113
0.037
sumo3a
-0.016
LOC108183490
0.036
h2afva
-0.016
LOC110439542
0.036
hnrnpabb
-0.015
cd81a
0.035
nono
-0.015
pmp22a
0.034
hmgb2b
-0.015
pi15b
0.034
srsf3a
-0.015
fosab
0.034
si:dkey-151g10.6
-0.015
si:ch211-114c12.5
0.034
ilf2
-0.015
RNF14
0.033
rpl38
-0.015
hepacama
0.033
si:ch211-152c2.3
-0.015
XLOC-002638
0.032
rps19
-0.014
lama4
0.032
fthl27
-0.014
prl2
0.032
stm
-0.014
mcamb
0.032
rps20
-0.014
socs3a
0.031
rcc2
-0.014
si:dkey-95h12.1
0.031
smarce1
-0.014
CU694486.1
0.030
rps23
-0.014
gpr31
0.030
si:dkey-56m19.5
-0.013
si:ch211-112b1.2
0.030
snrpc
-0.013
col4a1
0.030
hmgb1b
-0.013
si:dkey-285b23.4
0.029
hspb1
-0.013
si:dkey-183c2.4
0.029
rps21
-0.013
CABZ01088025.1
0.029
rpl39
-0.013
sdc4
0.029
lsm6
-0.013