Daniocell
fbxo36a (mural cells / non-skeletal muscle)
F-box protein 36a
ZFIN
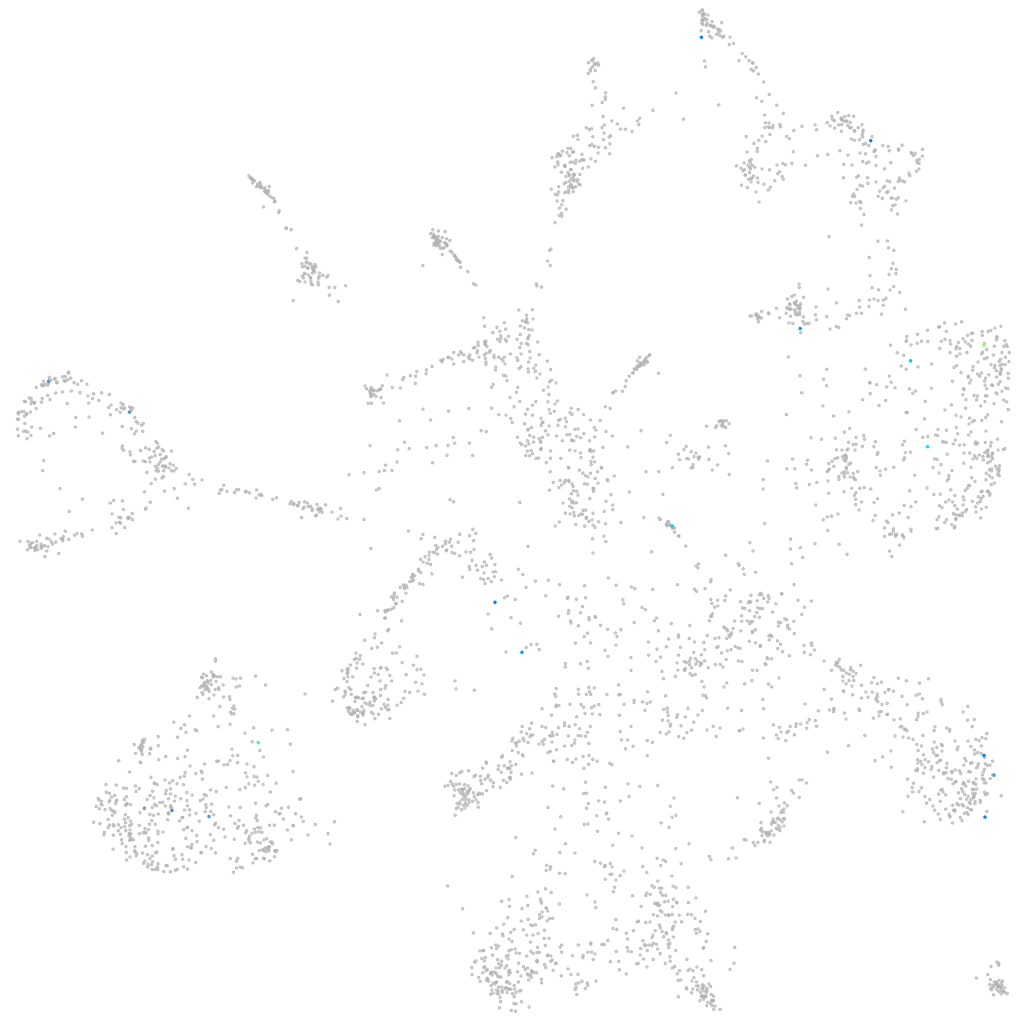
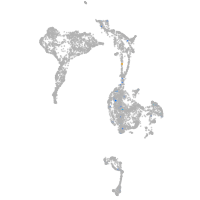
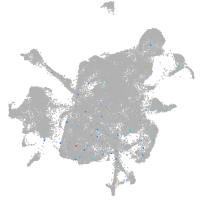
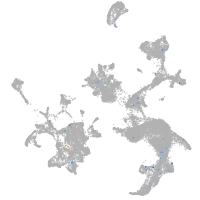
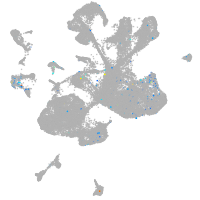
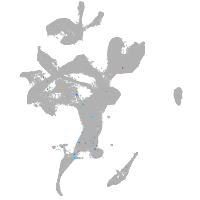
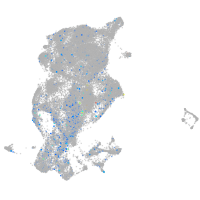
Gene expression UMAP
Display:
Expression
Stage
Other cell groups
all cells
blastomeres
PGCs
endoderm
axial mesoderm
muscle
mural cells /
non-skeletal muscle
mesenchyme
hematopoietic /
vasculature
pronephros
neural
spinal cord / glia
eye
taste / olfactory
otic / lateral line
epidermis
periderm
fin
ionocytes / mucous
pigment cells
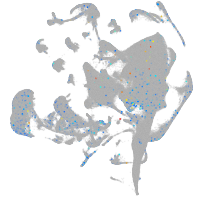
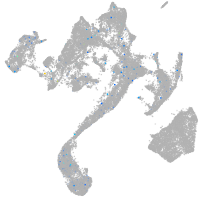
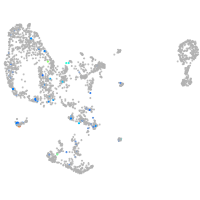
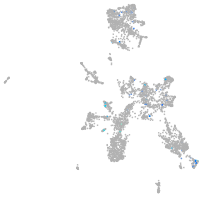
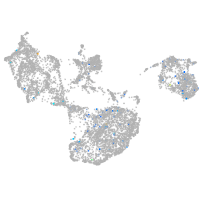
Expression by stage/cluster
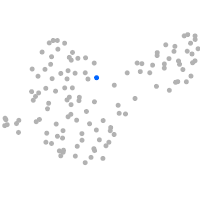
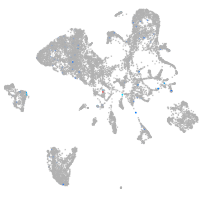
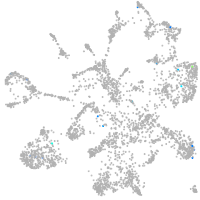
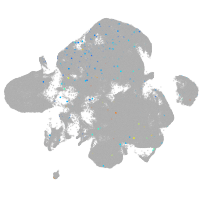
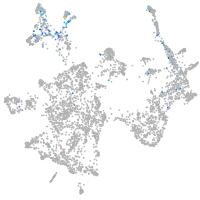
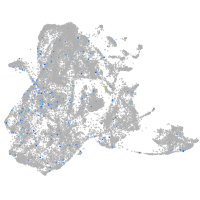
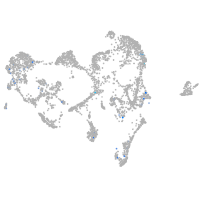
Correlated gene expression
Positive correlation
Negative correlation
Gene
r
Gene
r
si:ch211-272b8.6
0.331
col1a1b
-0.034
CU655961.3
0.307
calm2a
-0.033
LOC103910960
0.301
mylkb
-0.032
AL590134.1
0.257
tpm4b
-0.030
AL833789.1
0.248
zgc:153704
-0.030
XLOC-019042
0.234
col6a1
-0.030
si:ch1073-416j23.1
0.232
ntn5
-0.030
tas2r202
0.232
tpm1
-0.029
gzm3.4
0.221
BX908750.1
-0.029
LOC101885981
0.219
ube2al
-0.028
tyr
0.210
inka1a
-0.028
znf1018
0.192
col6a2
-0.028
LOC100537032
0.183
bcas2
-0.027
LOC110438610
0.180
stom
-0.027
CU914622.2
0.173
icn2
-0.027
si:dkey-57l19.1
0.162
hbbe1.3
-0.027
LOC103909136
0.157
wnt5b
-0.027
XLOC-043151
0.156
XLOC-028370
-0.027
rab11fip4b
0.155
BX088707.3
-0.026
SH3RF3
0.155
si:ch211-194k22.8
-0.026
si:dkey-46i9.6
0.152
hectd1
-0.025
LOC100535592
0.152
srrm2
-0.025
LOC100537721
0.149
derl2
-0.025
LOC108179509
0.147
meis2a
-0.025
LOC108183930
0.144
serpine1
-0.025
hsd3b2
0.141
jund
-0.025
tlcd1
0.141
myl9a
-0.024
rom1a
0.136
reck
-0.024
zgc:171490
0.136
lbh
-0.024
LOC110438807
0.136
ctnna1
-0.024
BX663525.2
0.126
XLOC-041870
-0.024
zgc:174153
0.126
desmb
-0.024
slc43a3a
0.124
pcdh7b
-0.024
slc16a13
0.123
hpgd
-0.024
ARF5 (1 of many)
0.123
sntb2
-0.024